Fig. 5
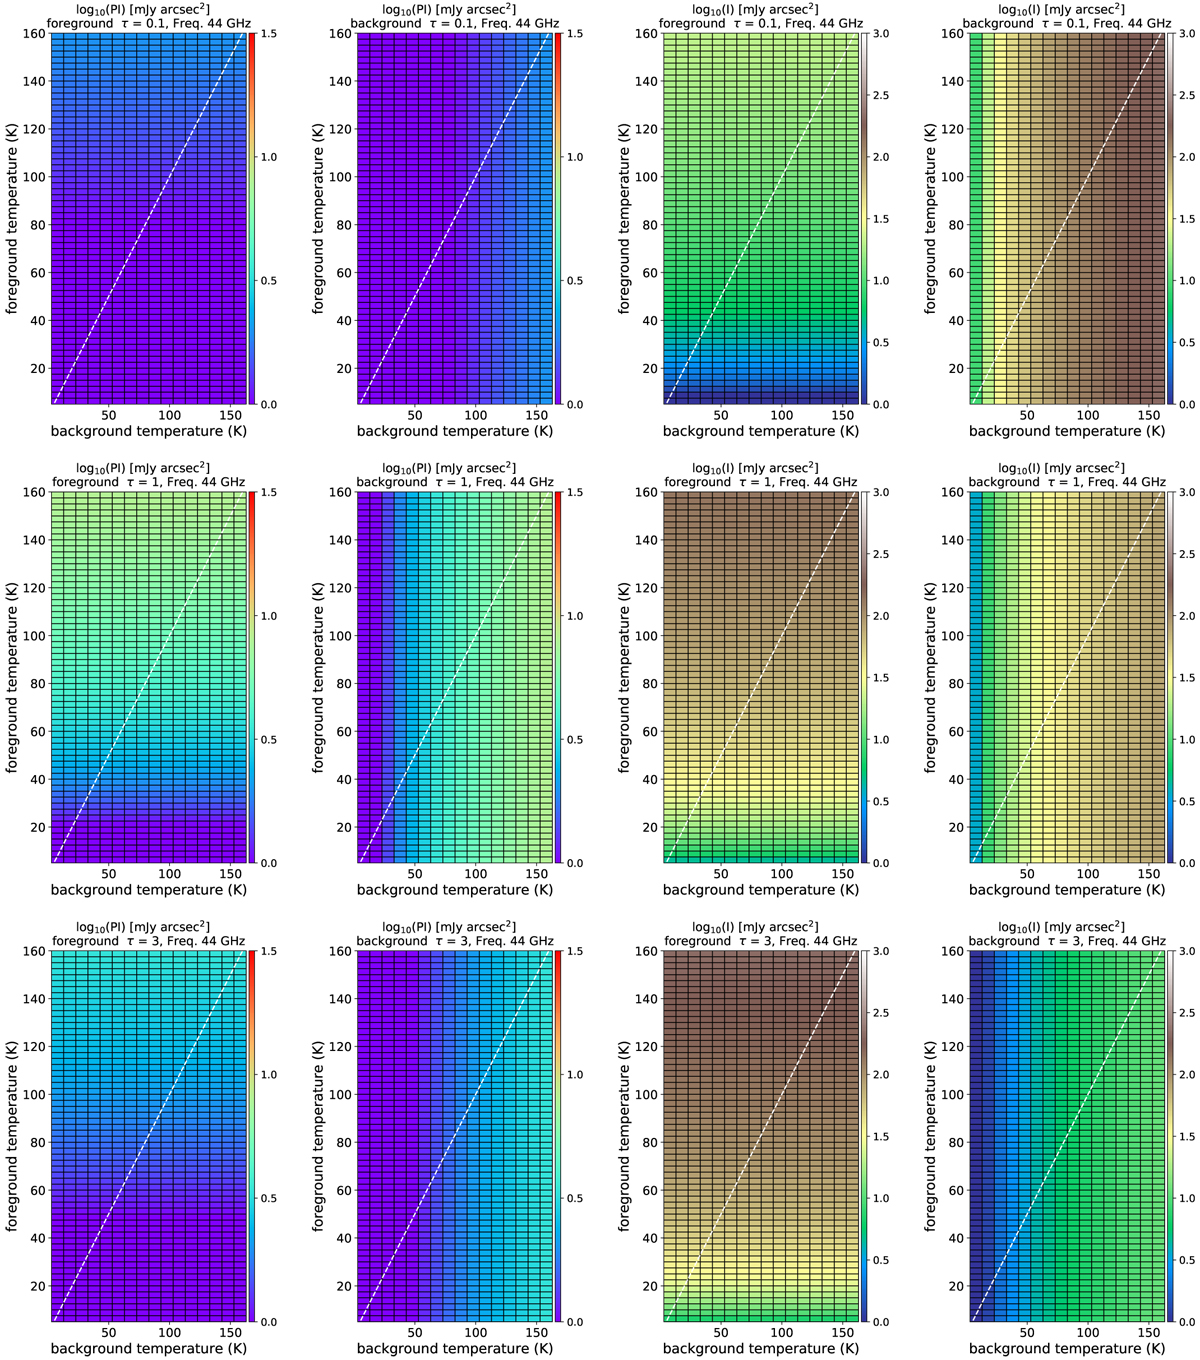
Derived polarization (PI) and total intensities (I) from the two-component model introduced in Sect. 4.1 (Eq. (1)), with α = 10% (Eq. (4)), and observing frequency ν = 44 GHz. Color bars are in mJy beam−1 units. Horizontal and vertical axes are dust temperatures of the background and foreground components Tfg and Tbg. White dashed lines show Tfg = Tbg. From top to bottom, the rows show the cases of τ = 0.1, 1, and 3, respectively.
Current usage metrics show cumulative count of Article Views (full-text article views including HTML views, PDF and ePub downloads, according to the available data) and Abstracts Views on Vision4Press platform.
Data correspond to usage on the plateform after 2015. The current usage metrics is available 48-96 hours after online publication and is updated daily on week days.
Initial download of the metrics may take a while.