Fig. 2
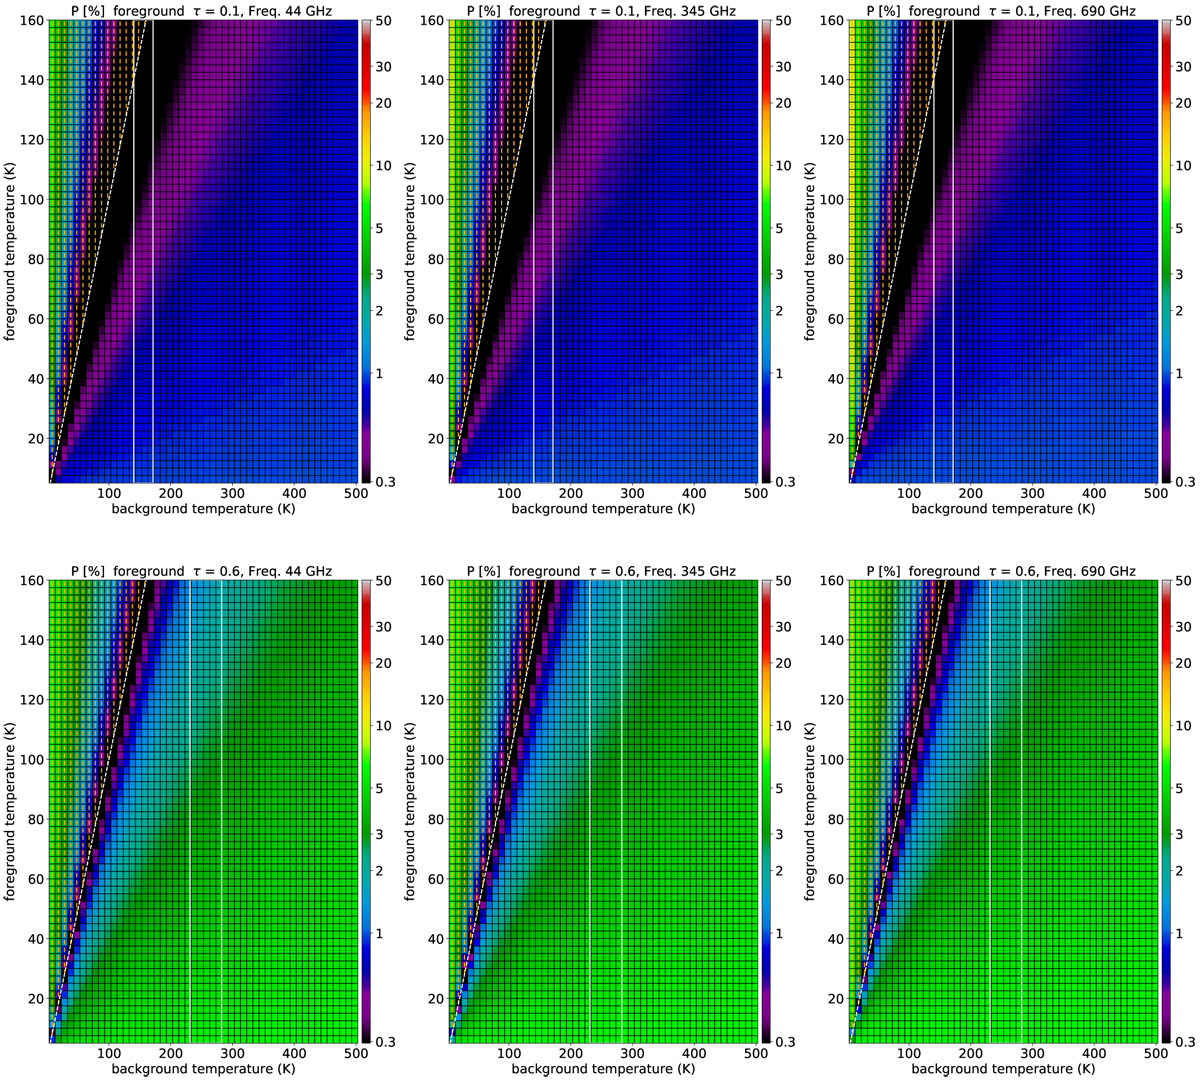
Derived polarization percentage (color) from the two-component model introduced in Sect. 4.1 (Eq. (1)), with α = 10% (Eq. (4)), and observing frequency ν = 44 (left column), 345 (middle column), and 690 GHz (right column). Color bars are in % units. Horizontaland vertical axes are dust temperatures of the background and foreground components Tfg and Tbg; the resolutions of Tfg and Tbg in our calculations are the same with the horizontal and vertical grids. White dashed lines show Tfg = Tbg. Top and bottom rows show the cases of τ = 0.1 and 0.6, respectively. The orange line segments indicate that the observed polarization position angle is identical tothat of the emission of foreground component; otherwise the observed polarization position angle is 90° offset from that of the emission of the foreground component. Vertical white lines show the extinction corrected peak brightness temperature of IRAS 16293–2422 B (141 ± 14 K)∕e−τ.
Current usage metrics show cumulative count of Article Views (full-text article views including HTML views, PDF and ePub downloads, according to the available data) and Abstracts Views on Vision4Press platform.
Data correspond to usage on the plateform after 2015. The current usage metrics is available 48-96 hours after online publication and is updated daily on week days.
Initial download of the metrics may take a while.