Fig. 1
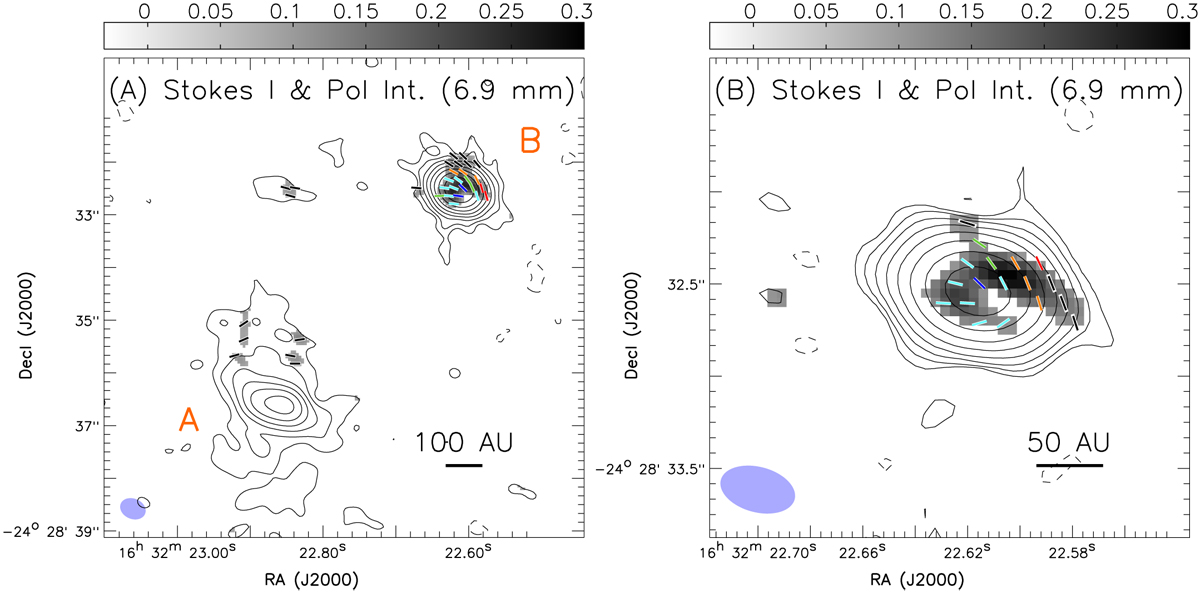
JVLA 40–48 GHz continuum images of IRAS 16293–2422. Panels a and b: Robust = 2 weighted images [θmaj × θmin = 0.′′ 49 × 0.′′ 38 (PA = 66°)] and the Robust = 0 weighted images [θmaj × θmin = 0.′′ 39 × 0.′′ 24 (PA = 74°)], respectively. Panel b only shows a small area around IRAS 16293–2422 B since the Robust = 0 weighted images only detect polarized intensity at >3σ from this region. The synthesized beams are shown in the bottom left of these panels. Contours present the Stokes I intensities.The polarized intensities are presented in grayscale. Contours in panels a and b are 0.03 mJy beam−1 (1σ, ~0.10 K) × [–3, 3, 6, 12, 24, 48, 96, 192, 384] and 0.035 mJy beam−1 (1σ, ~0.24 K) × [–3, 3, 6, 12, 24, 48, 96, 192, 384], respectively. Contours of negative intensity are dashed. Color bars are in mJy beam−1 units. The line segments present the measured polarization (E-field) position angles: blue, cyan, green, orange, red, and black colors represent the <1%, 1–2%, 2–3%, 3–5%, 5–10%, and >10% polarization percentages, respectively. The polarization percentages and polarization position angles measured at the centroids of these line segments are given in Tables B.1 and B.2.
Current usage metrics show cumulative count of Article Views (full-text article views including HTML views, PDF and ePub downloads, according to the available data) and Abstracts Views on Vision4Press platform.
Data correspond to usage on the plateform after 2015. The current usage metrics is available 48-96 hours after online publication and is updated daily on week days.
Initial download of the metrics may take a while.