Fig. 9

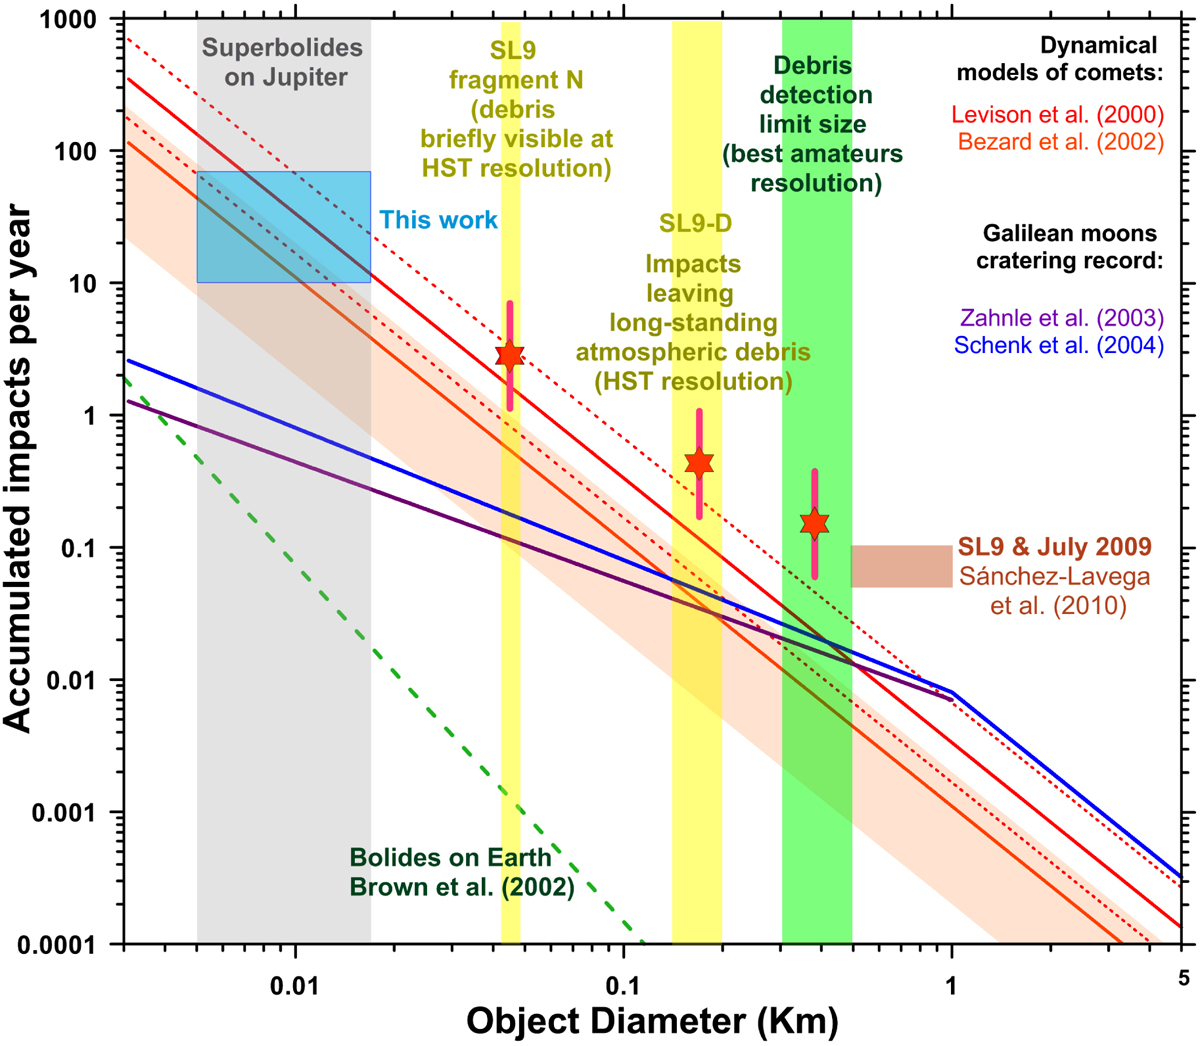
Impact rates on Jupiter and Earth compared. The vertical gray region represents the sizes of the five bolides, and the blue box represents the impact rate of 5–20 m size objects on Jupiter. The lines represent impact rates from (a) dynamical models of comets (red line with estimated uncertainties as the dotted line, Levison et al. 2000; (b) orange line and estimated uncertainties from corrections to that model introduced by Bézard et al. 2002, or; (c) the cratering record of Galilean moons (magenta line from Zahnle et al. 2003; blue line from Schenk et al. 2004). This is compared with estimates of the impact rate on Earth from Brown et al. 2002). The yellow regions indicate the limiting size of objects that might be discovered based on the dark debris that they are expected to leave in the atmosphere of Jupiter: The smallest SL9 fragment that produced a detectable debris field on HST images (fragment N) and long-standing debris features associated with objects of 170 m such as SL9 fragment D are highlighted. The green vertical region represents objects leaving a debris field that might be detected with amateur equipment. The light-brown box represents estimates of impact rates on Jupiter from Sánchez-Lavega et al. (2010) for 0.5–1.5 km size objects. Estimates of the impact rate of intermediate-size objects that hit the planet and form observable debris fields are plotted as red stars. The error bars represent anuncertainty factor of 2.5 upward and downward. Figure updated from Hueso et al. (2013).
Current usage metrics show cumulative count of Article Views (full-text article views including HTML views, PDF and ePub downloads, according to the available data) and Abstracts Views on Vision4Press platform.
Data correspond to usage on the plateform after 2015. The current usage metrics is available 48-96 hours after online publication and is updated daily on week days.
Initial download of the metrics may take a while.


