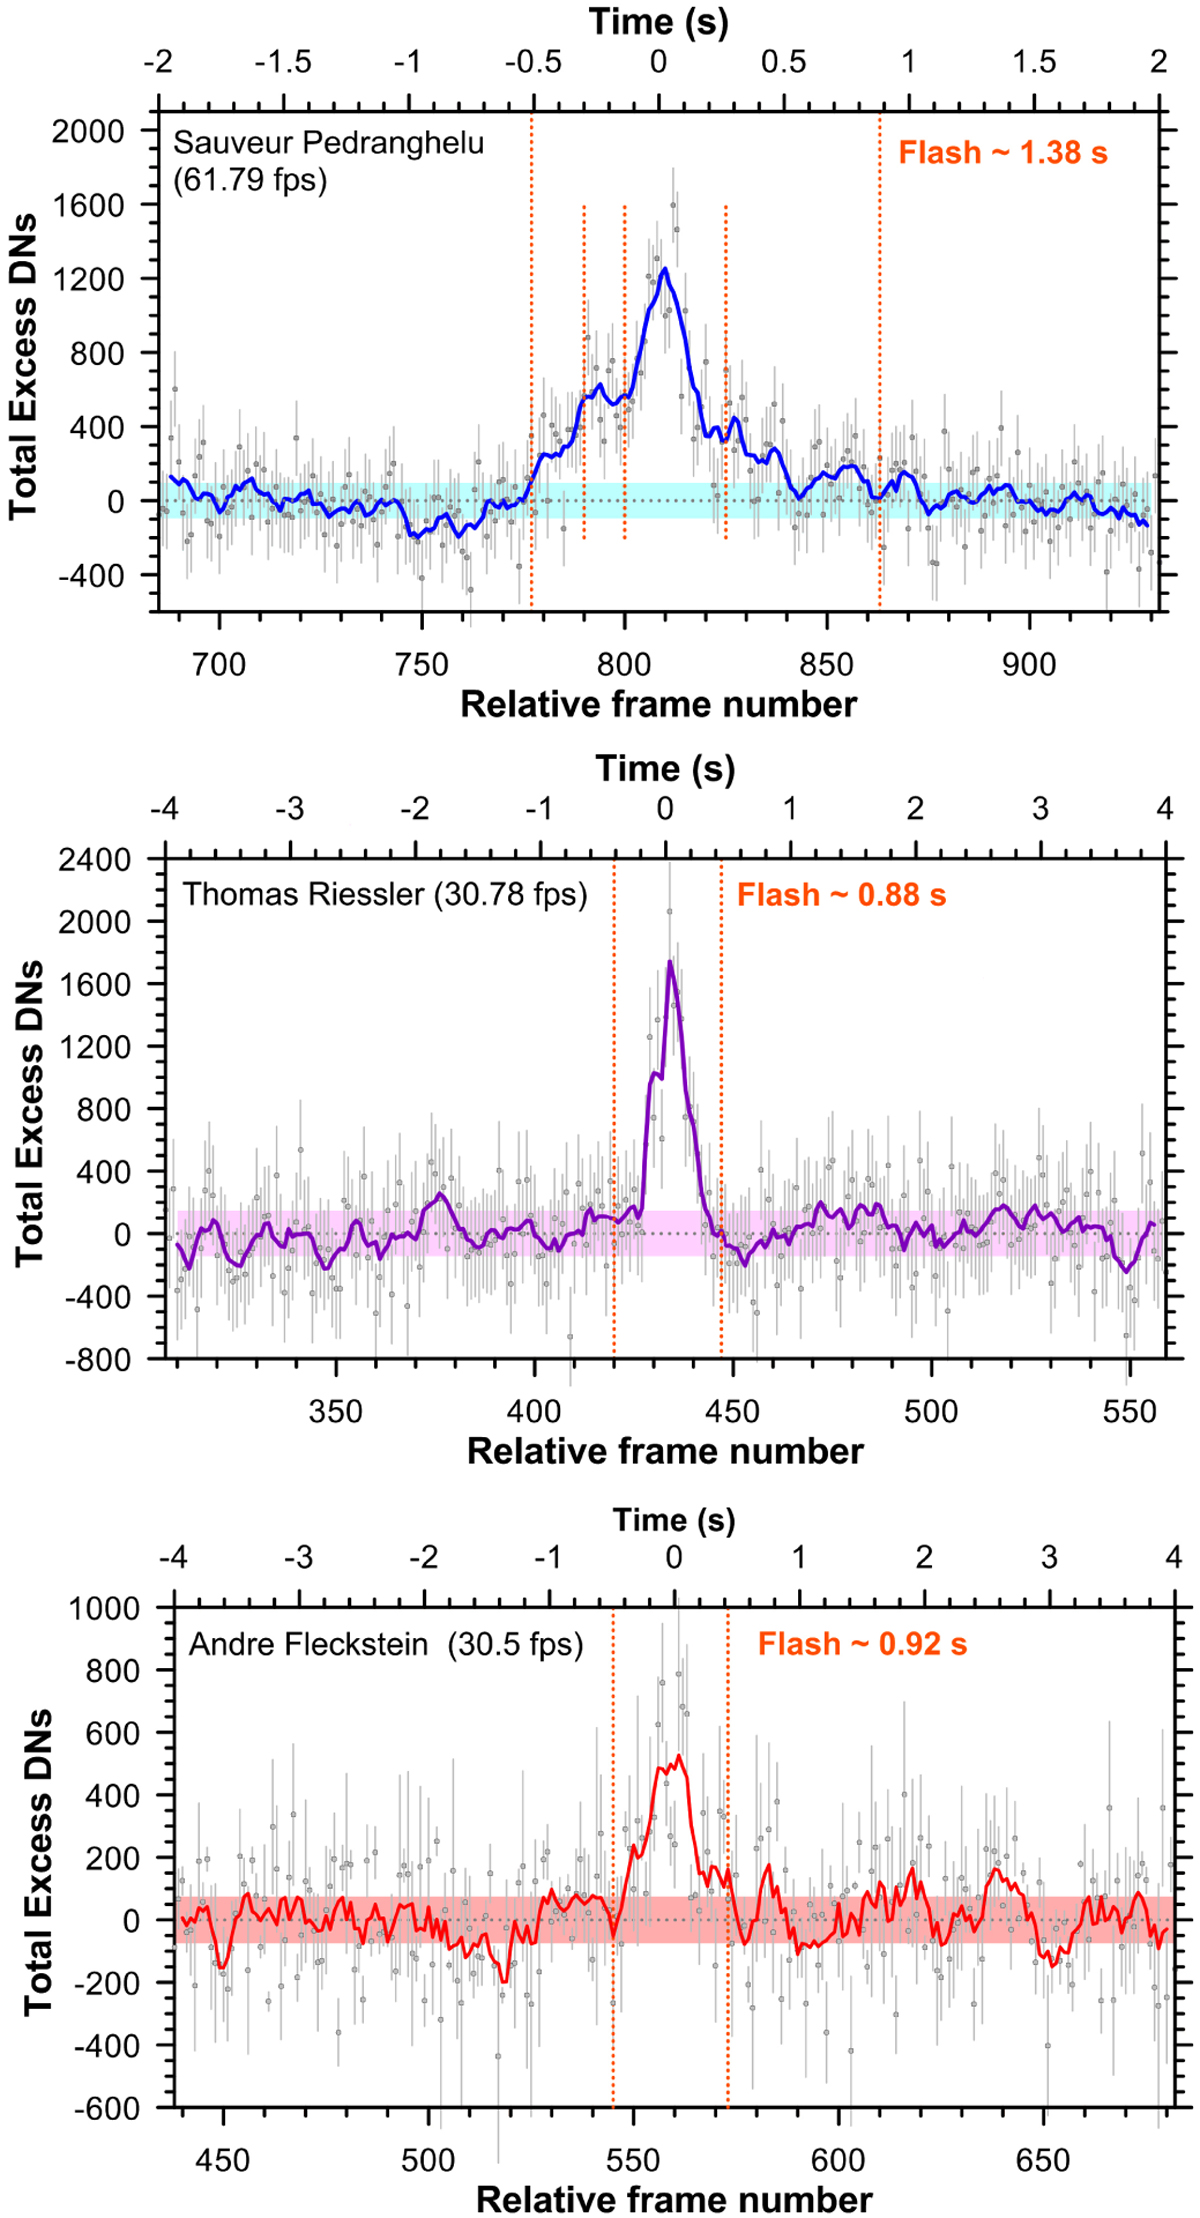
Fig. 6

Raw light curves of the May 2017 impact. Top panel: data from Sauveur Pedranghelu. The light curve has different phases that are identified with vertical orange lines: a first flash of 0.21 s, a second phase with constant flux for 0.16 s, acentral flash of 0.40 s, and an extended decay for another 0.32–0.61 s for a total flash duration of 1.38 s. Middle panel: data from Thomas Riessler showing the double flash with a slightly shorter duration. Bottom panel: data from André Fleckstein. The video by T.R. does not show the same amount of structure visible in the first light curve, possibly because of the different frame rates and smaller pixel size. The video by A.F. was acquired under poorer seeing conditions.
Current usage metrics show cumulative count of Article Views (full-text article views including HTML views, PDF and ePub downloads, according to the available data) and Abstracts Views on Vision4Press platform.
Data correspond to usage on the plateform after 2015. The current usage metrics is available 48-96 hours after online publication and is updated daily on week days.
Initial download of the metrics may take a while.


