Fig. 9
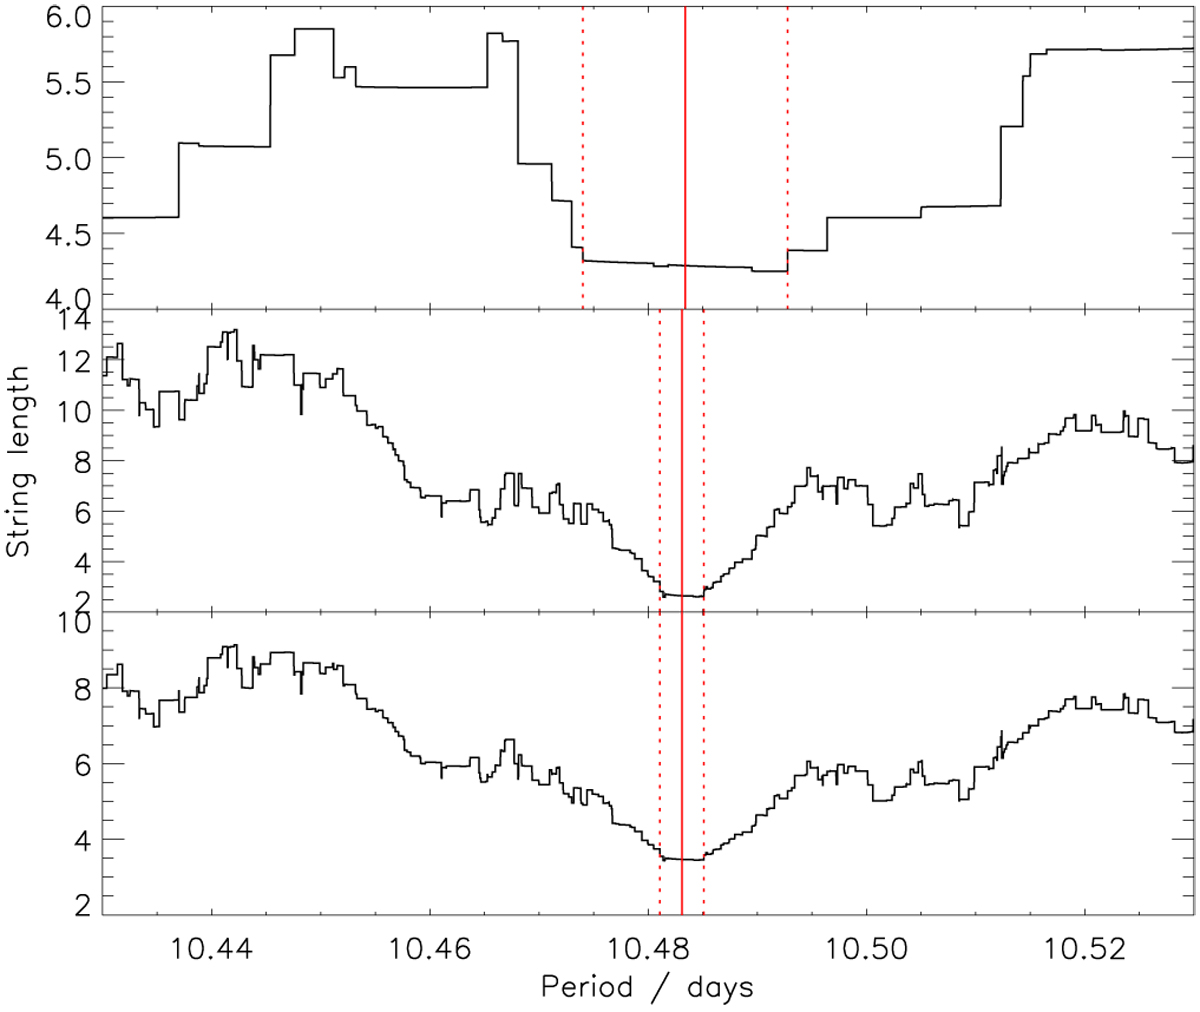
String length values for candidate F2 periods near expected period: for the light curve data (upper panel), WNL radial velocities (middle panel) and combined light curve and radial velocities (lower panel). Dotted red vertical lines indicate the bounds of the region in each panel where the string length statistic is relatively constant and near its minimum value. Solid red vertical lines indicate the mid-point of these ranges.
Current usage metrics show cumulative count of Article Views (full-text article views including HTML views, PDF and ePub downloads, according to the available data) and Abstracts Views on Vision4Press platform.
Data correspond to usage on the plateform after 2015. The current usage metrics is available 48-96 hours after online publication and is updated daily on week days.
Initial download of the metrics may take a while.