Fig. 7
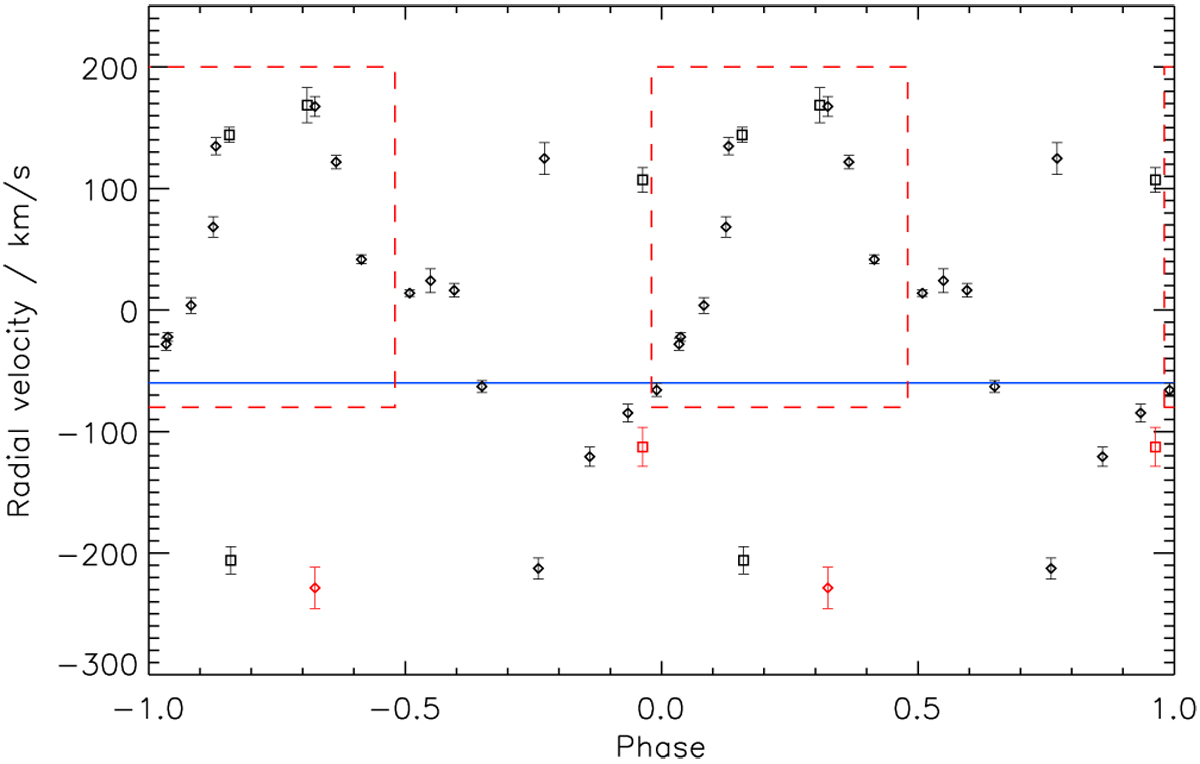
RV curve measured from C IV 2.079 μm line. SINFONI data are plotted as diamonds and KMOS as squares. The horizontal line indicates the approximate systemic velocity (relative to F1) found from the primary curve (Fig. 5). Most of the data points indicate thevelocity corresponding to a single-peaked cross-correlation function, or the stronger peak of a deblended double-peaked function. However, the two red data points indicate a weaker but still significant peak in a deblended double-peaked function. The velocities taken as indicative of the behaviour of the secondary component are surrounded by the red dashed line, and are included in Table 2.
Current usage metrics show cumulative count of Article Views (full-text article views including HTML views, PDF and ePub downloads, according to the available data) and Abstracts Views on Vision4Press platform.
Data correspond to usage on the plateform after 2015. The current usage metrics is available 48-96 hours after online publication and is updated daily on week days.
Initial download of the metrics may take a while.