Fig. 5
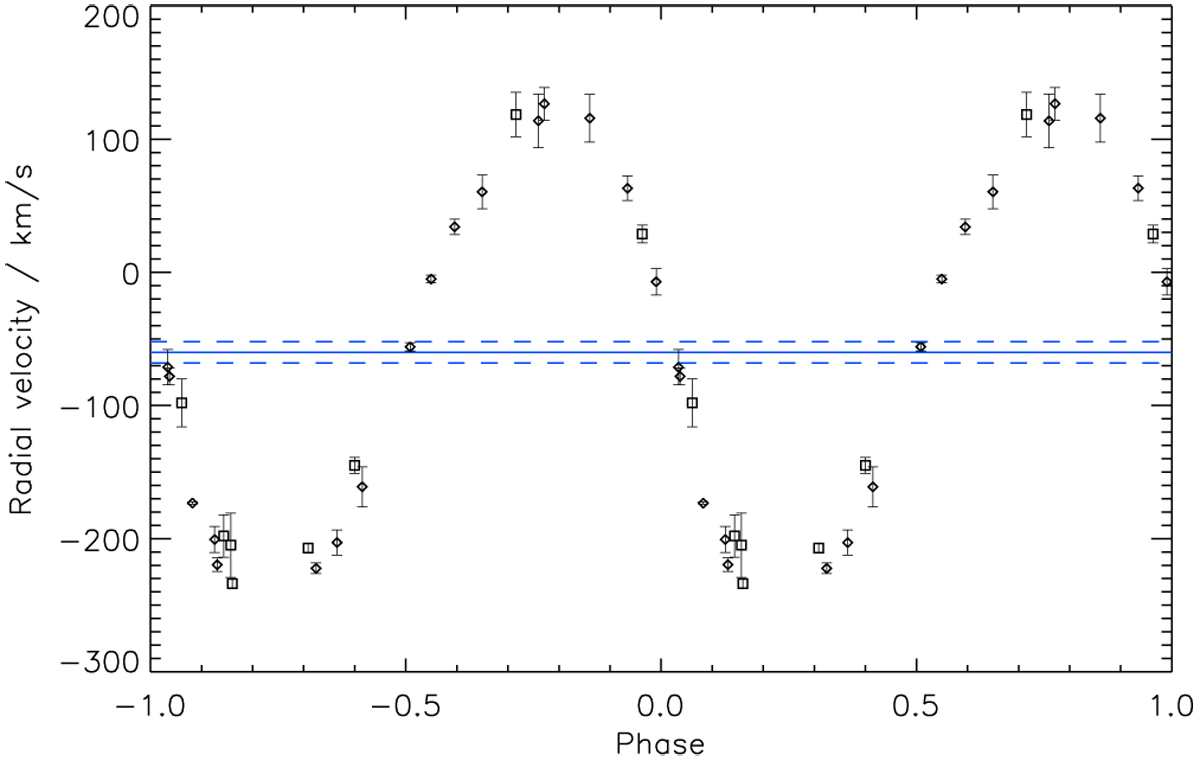
Combined RV curve for the assumed WNL primary of F2. SINFONI data are plotted as diamonds; KMOS and NIRSPEC as squares. The solid blue horizontal line indicates the approximate systemic velocity (relative to F1); the dashed blue lines indicate the systemic velocities associated with the curves derived from the Brγ and N III lines separately, and may be taken as the uncertainty on the systemic velocity for the combined RV curve.
Current usage metrics show cumulative count of Article Views (full-text article views including HTML views, PDF and ePub downloads, according to the available data) and Abstracts Views on Vision4Press platform.
Data correspond to usage on the plateform after 2015. The current usage metrics is available 48-96 hours after online publication and is updated daily on week days.
Initial download of the metrics may take a while.