Fig. 17
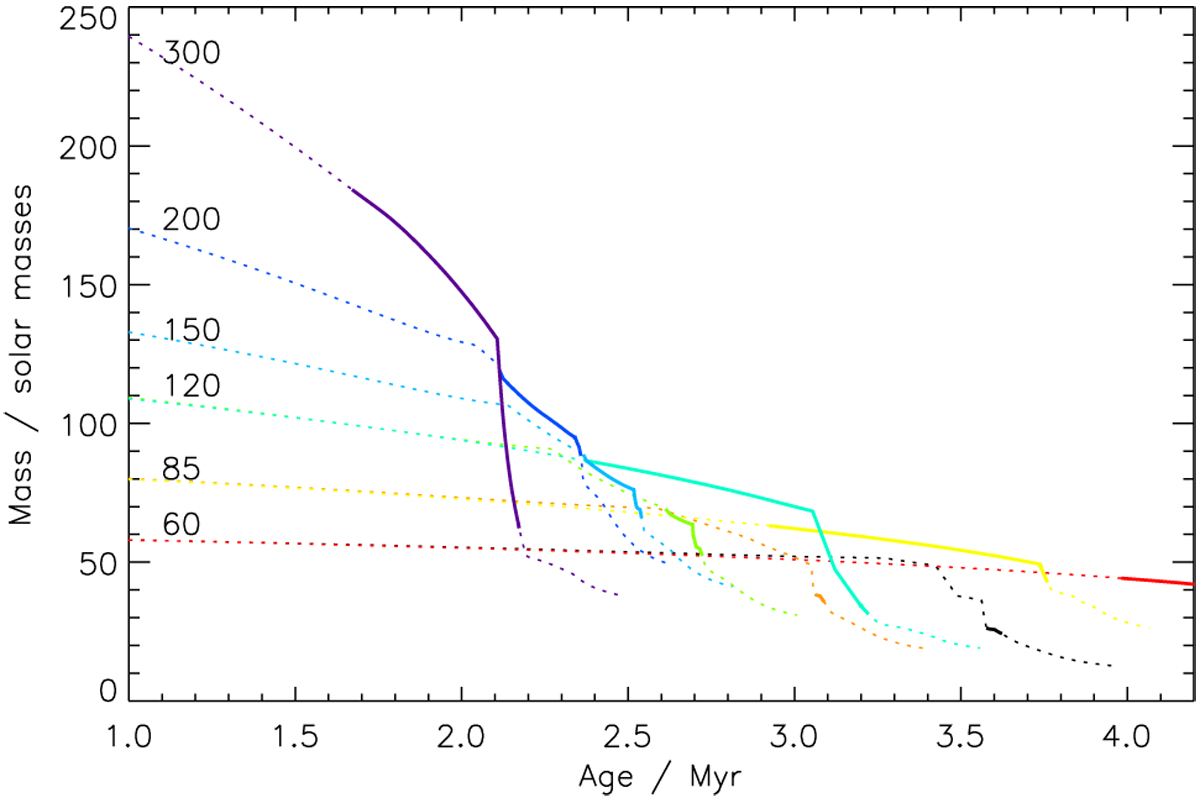
Mass over time for candidate primary component of F2, from latest Geneva evolutionary models with Z = 0.014. Initial masses are shown (in solar masses) next to each track on the left; for the 60, 85, and 120 M⊙ tracks, bothrotating and non-rotating models are shown (the rotating models are in red, yellow, and cyan respectively, and have greater duration than the corresponding non-rotating versions in black, orange and green); for higher initial masses, only non-rotating models are available. Each track follows the life of a star to the end of the C burning stage (dotted lines); WNL phases, as defined in Georgy et al. (2012), are shown in thicker solid lines.
Current usage metrics show cumulative count of Article Views (full-text article views including HTML views, PDF and ePub downloads, according to the available data) and Abstracts Views on Vision4Press platform.
Data correspond to usage on the plateform after 2015. The current usage metrics is available 48-96 hours after online publication and is updated daily on week days.
Initial download of the metrics may take a while.