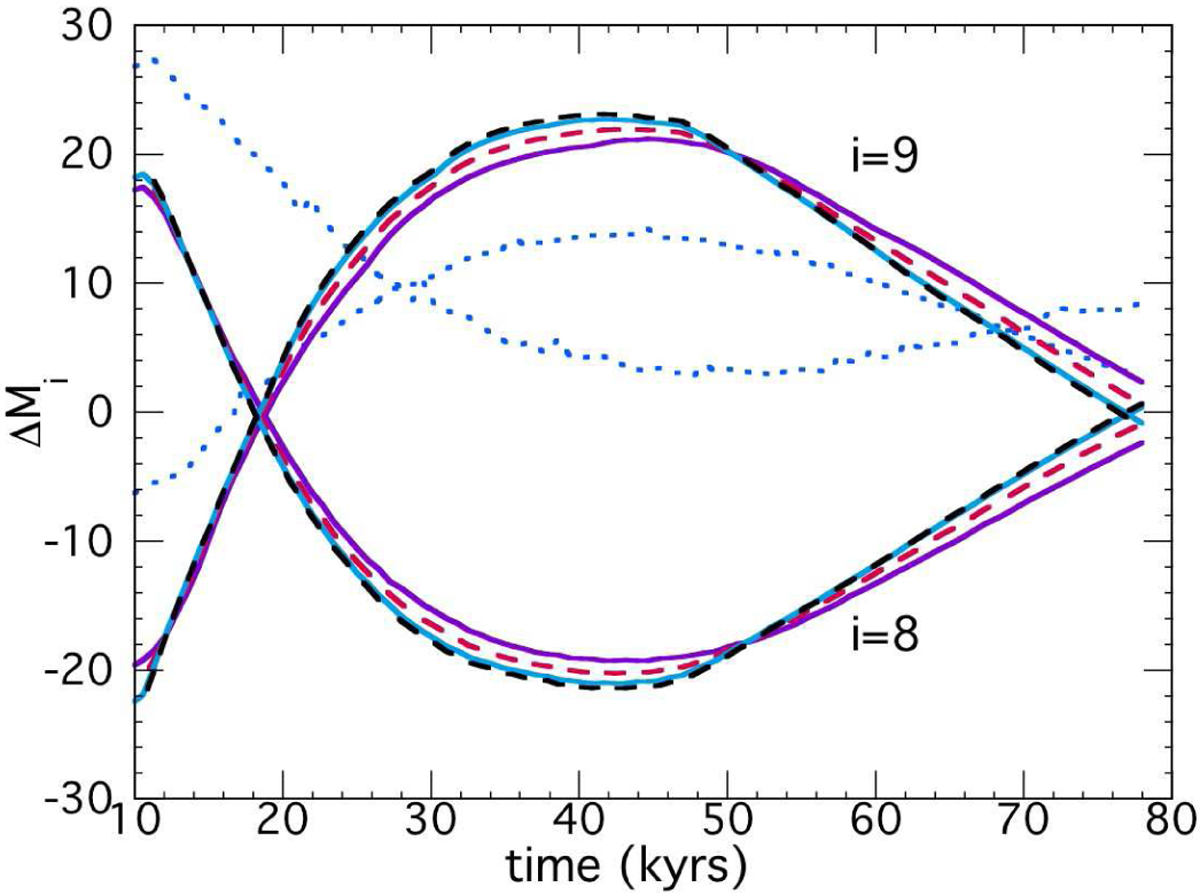
Fig. A.1

Mass variation ΔMi (%) of the two angular sectors i = 8 and i = 9 already shown in Fig. 5, for five different resolutions. The dotted curves correspond to a low resolution simulation with 2700 × 2700 mesh cells (dx = dy = 3.2 × 10¹⁴ m). The full cyan lines are obtained for the resolution used in Fig. 5 (high resolution with 54002 mesh cells and dx = dy = 1.6 × 10¹⁴ m). The other curves (full purple, dashed red, and dashed black) have been plotted for both intermediate (respectively for 36002, 43202 cells) and higher resolutions (72002 cells).
Current usage metrics show cumulative count of Article Views (full-text article views including HTML views, PDF and ePub downloads, according to the available data) and Abstracts Views on Vision4Press platform.
Data correspond to usage on the plateform after 2015. The current usage metrics is available 48-96 hours after online publication and is updated daily on week days.
Initial download of the metrics may take a while.


