Fig. 4.
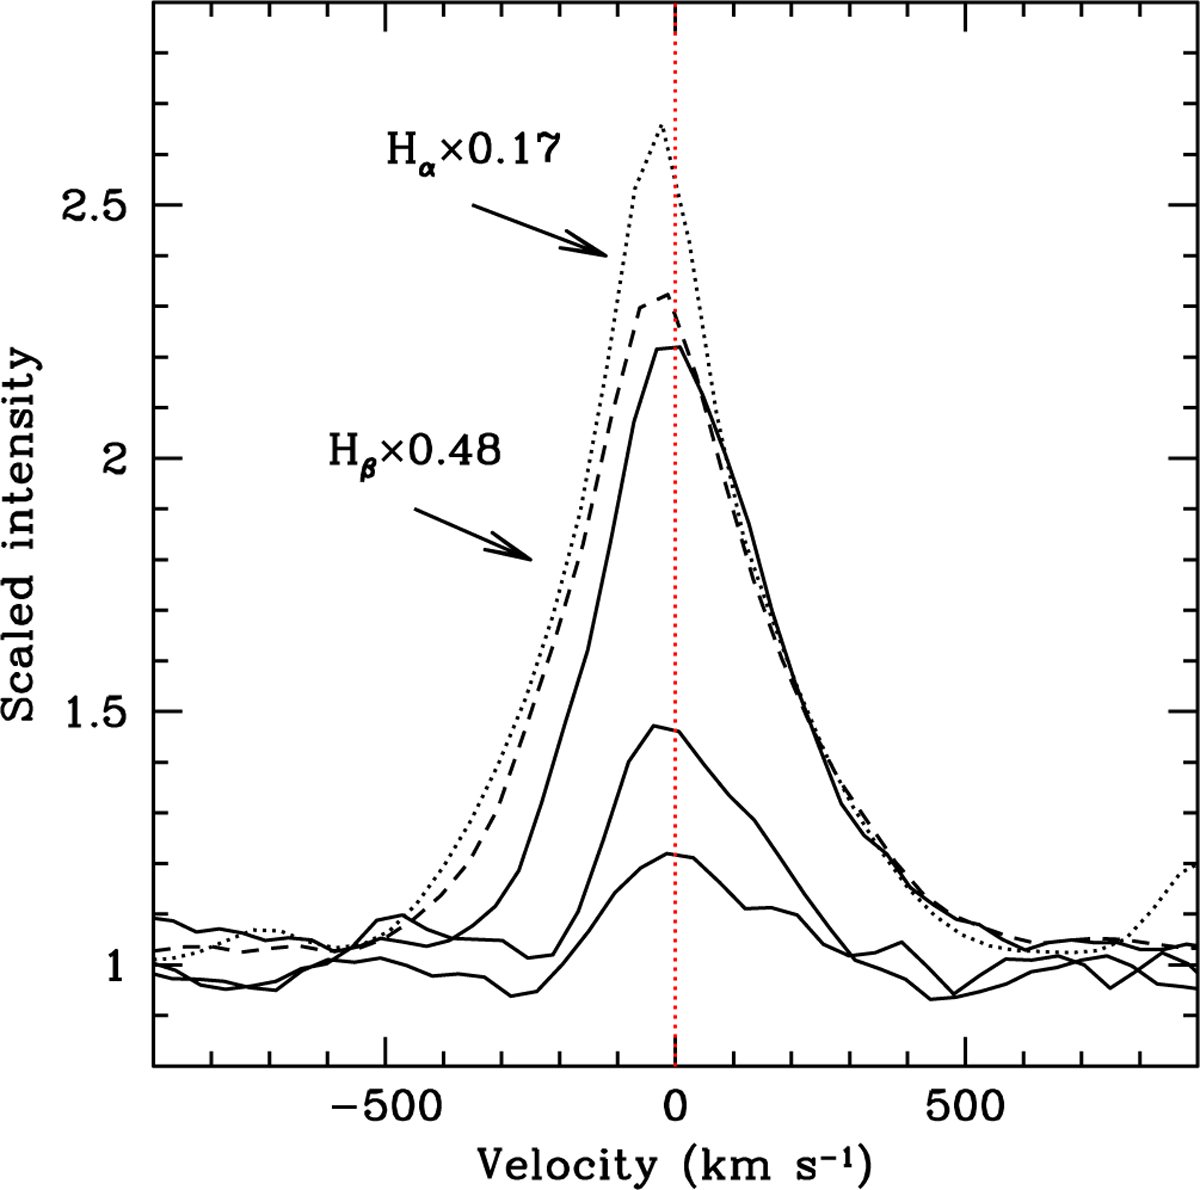
Line profiles of the Balmer-H sequence plotted on a velocity scale corrected for the adopted −179 km s−1 systemic velocity. The lines of Hα and Hβ are scaled by factors of 0.17 and 0.48, respectively, so as to align the red wings with that of Hγ. The continuous lines show Hγ, H∊, and H I 3835 Å. The progressive red-shift at shorter wavelengths appears to be a consequence of the increasing strength of the blue-shifted absorption which, in the helium lines, takes on the form of P Cyg absorption. This effect is explained by the fact that the optical depth of the wind is highest for Hα and Hβ and decreases for lines that have smaller transition probabilities.
Current usage metrics show cumulative count of Article Views (full-text article views including HTML views, PDF and ePub downloads, according to the available data) and Abstracts Views on Vision4Press platform.
Data correspond to usage on the plateform after 2015. The current usage metrics is available 48-96 hours after online publication and is updated daily on week days.
Initial download of the metrics may take a while.