Fig. 3.
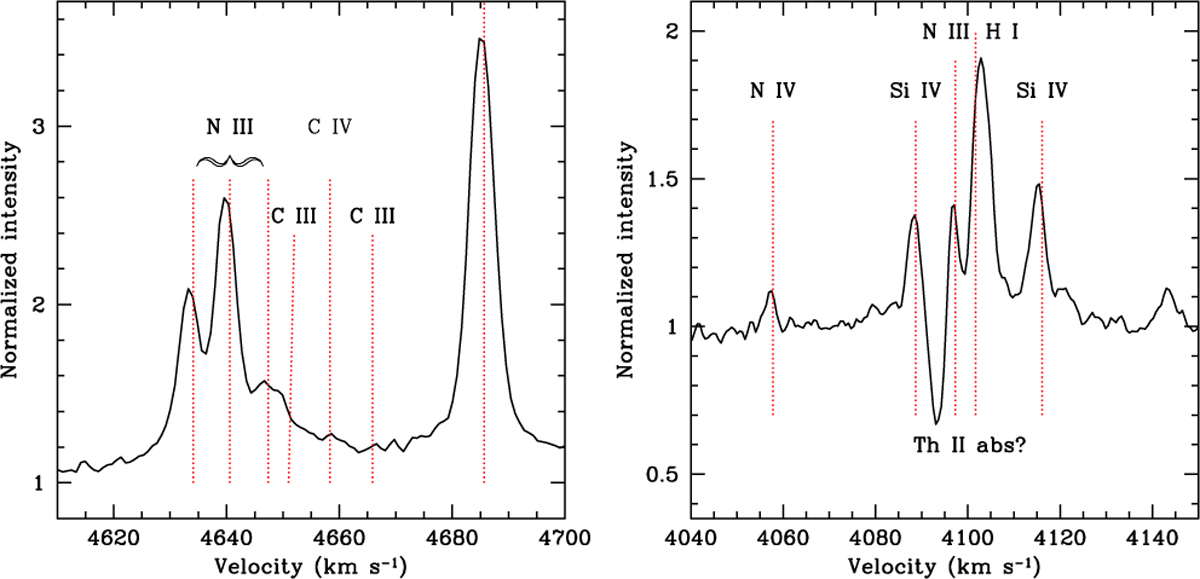
Line profiles on a wavelength scale corrected for the adopted −179 km s−1 systemic velocity of M 33. Left: N III 4634-41 and He ii 4686 emission lines. We note the possible contribution of C IV. Right: N IV 4058 and the 4100 Å blend that includes Si IV, N III, and H I lines. Vertical lines indicate the laboratory wavelength of the transitions.
Current usage metrics show cumulative count of Article Views (full-text article views including HTML views, PDF and ePub downloads, according to the available data) and Abstracts Views on Vision4Press platform.
Data correspond to usage on the plateform after 2015. The current usage metrics is available 48-96 hours after online publication and is updated daily on week days.
Initial download of the metrics may take a while.