Fig. A.1.
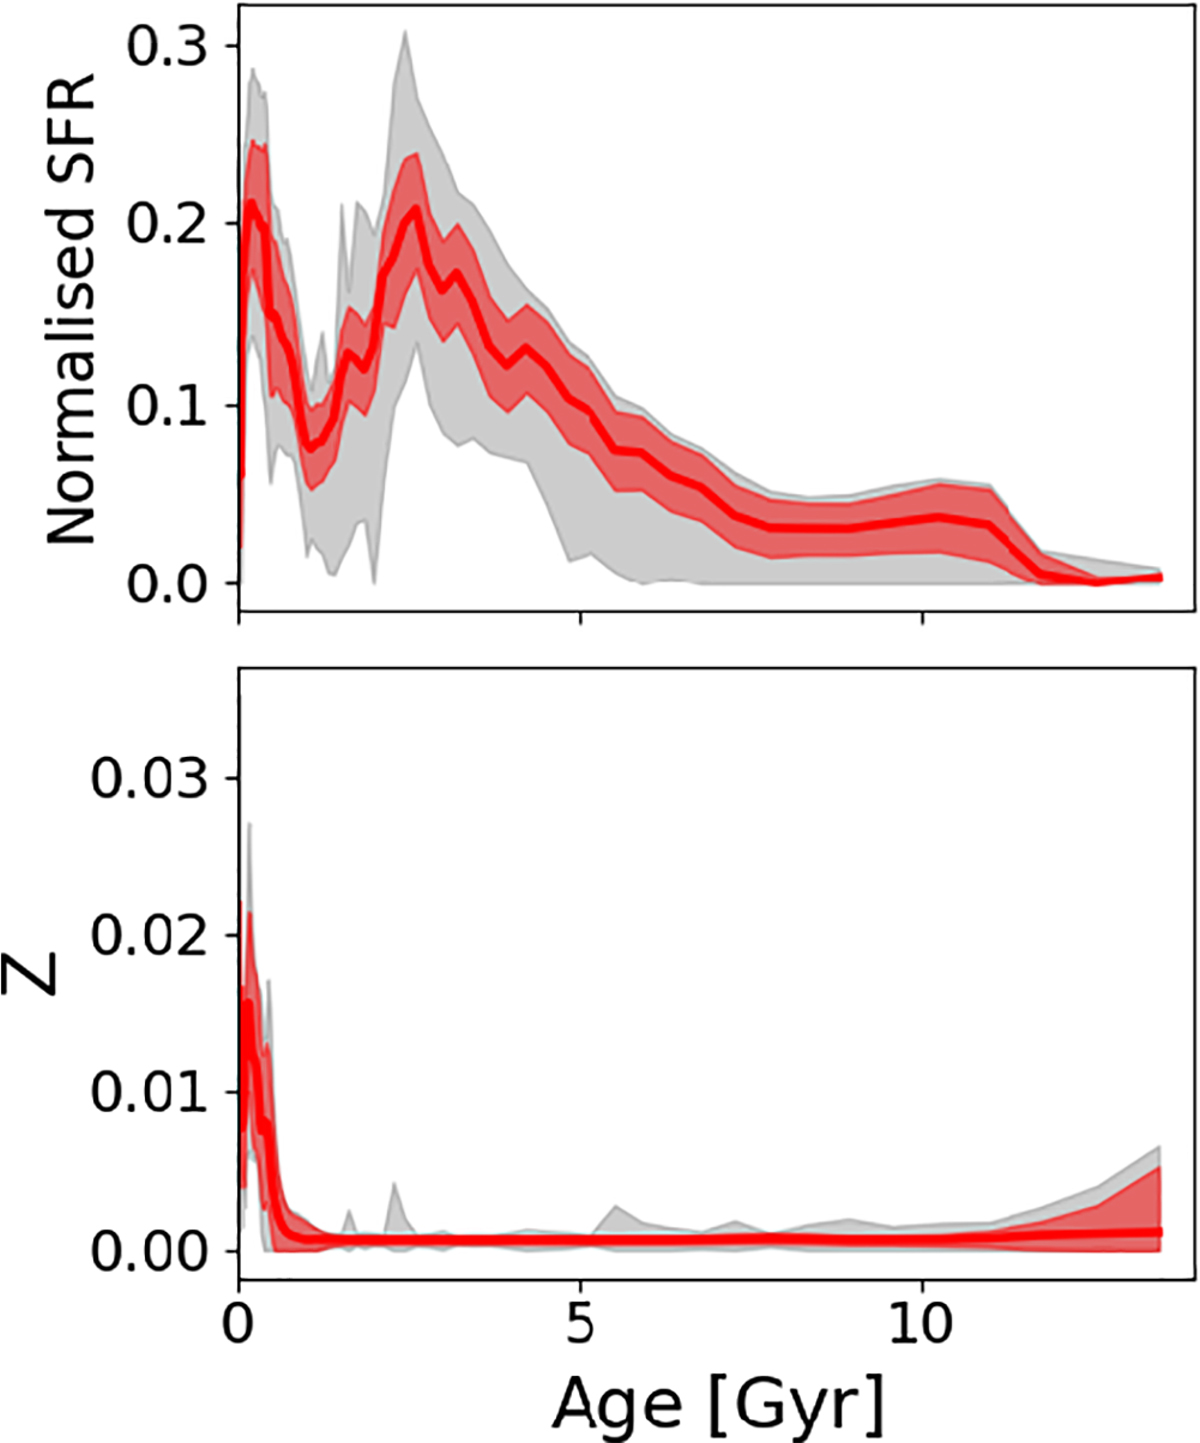
Comparison of the SFHs recovered from the analysis of the Leo A integrated spectrum using different smoothing parameters (see Table A.1). Panels are the same as the top and middle panels of Fig. 5. In red we show the best solution (minimum rms) for extraction A (run 6). Embedded in the grey shaded area are runs 1 to 11 using extraction A, including errors.
Current usage metrics show cumulative count of Article Views (full-text article views including HTML views, PDF and ePub downloads, according to the available data) and Abstracts Views on Vision4Press platform.
Data correspond to usage on the plateform after 2015. The current usage metrics is available 48-96 hours after online publication and is updated daily on week days.
Initial download of the metrics may take a while.