Fig. A.5.
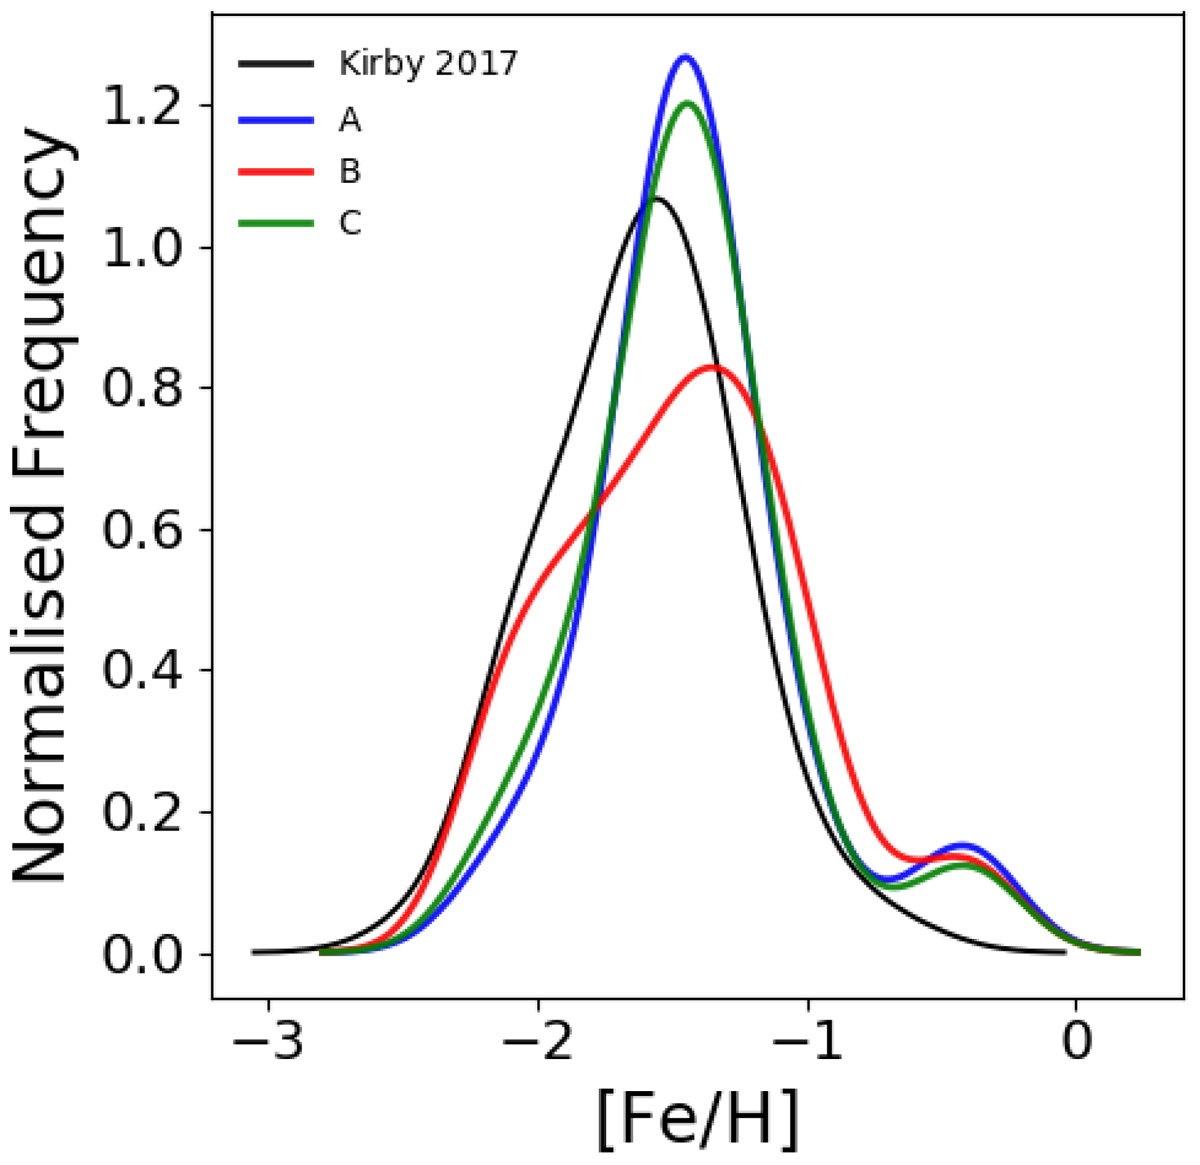
Modelled and observed RGB stars metallicity distributions. We compare the metallicity distributions of the RGB stars from the best-model CMD for tests A, B, and C (blue, red, and green) with that presented in Kirby et al. (2017) determined through the spectroscopic analysis of individual stars (black, 113 stars). The distributions are built as the sum of individual Gaussians for each star.
Current usage metrics show cumulative count of Article Views (full-text article views including HTML views, PDF and ePub downloads, according to the available data) and Abstracts Views on Vision4Press platform.
Data correspond to usage on the plateform after 2015. The current usage metrics is available 48-96 hours after online publication and is updated daily on week days.
Initial download of the metrics may take a while.