Fig. 1.
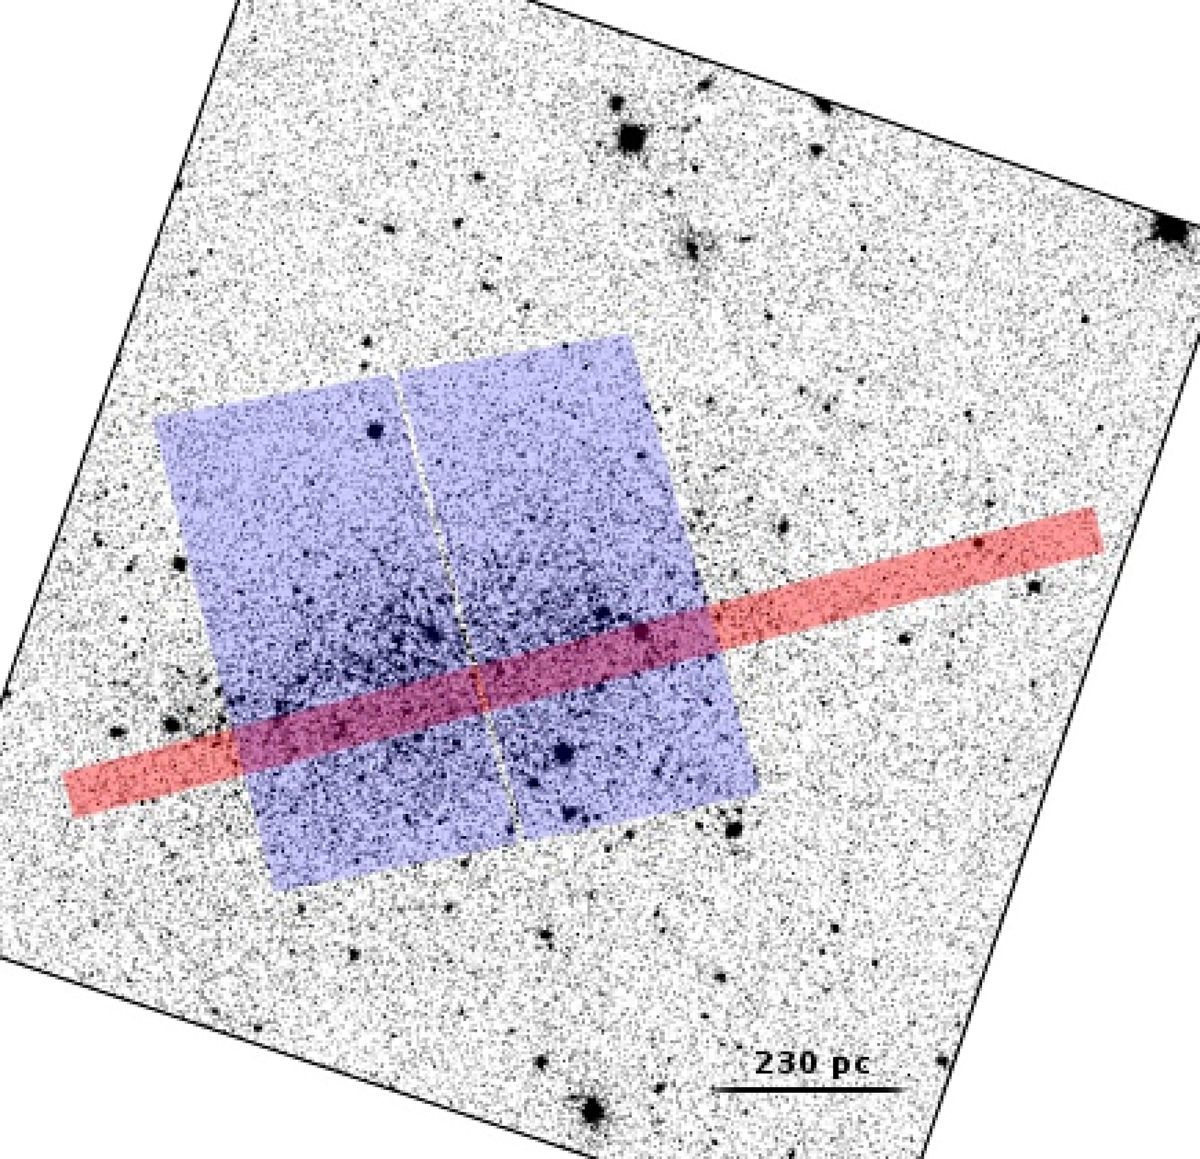
Observational layout: SDSS r-band image (Abazajian et al. 2009) of Leo A with the fields analysed in this works superimposed. The blue shaded area corresponds to the HST/ACS field. The red shaded area represents the scanned region observed with GTC/OSIRIS. The area of overlap between the two datasets is the comparison area from where both SFHs are extracted.
Current usage metrics show cumulative count of Article Views (full-text article views including HTML views, PDF and ePub downloads, according to the available data) and Abstracts Views on Vision4Press platform.
Data correspond to usage on the plateform after 2015. The current usage metrics is available 48-96 hours after online publication and is updated daily on week days.
Initial download of the metrics may take a while.