Free Access
Fig. A.7
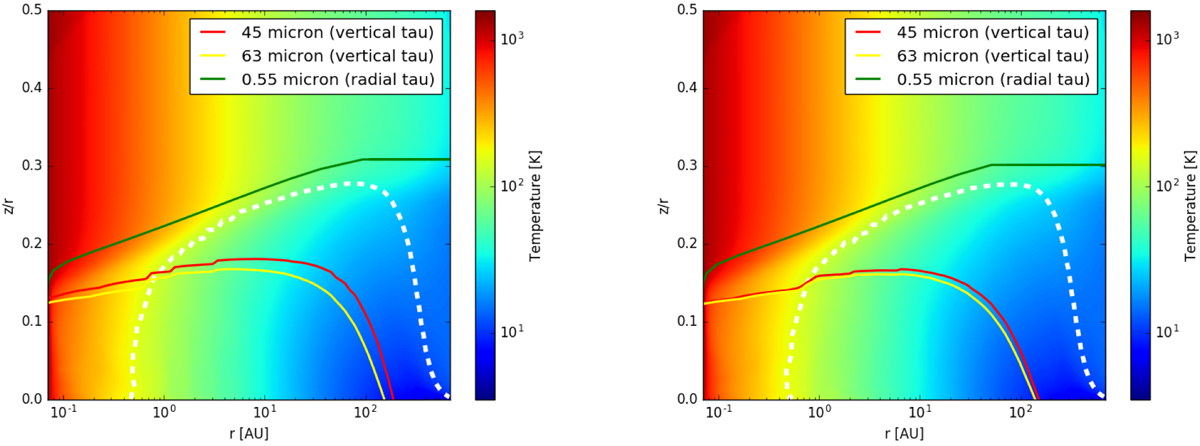
Two-dimensional (2D) dust temperature distribution in the model series with different water ice thermal histories; for comparison, the first panel shows the reference disk model. The contour lines have the same meaning as in Fig. 2.
Current usage metrics show cumulative count of Article Views (full-text article views including HTML views, PDF and ePub downloads, according to the available data) and Abstracts Views on Vision4Press platform.
Data correspond to usage on the plateform after 2015. The current usage metrics is available 48-96 hours after online publication and is updated daily on week days.
Initial download of the metrics may take a while.