Fig. 1.
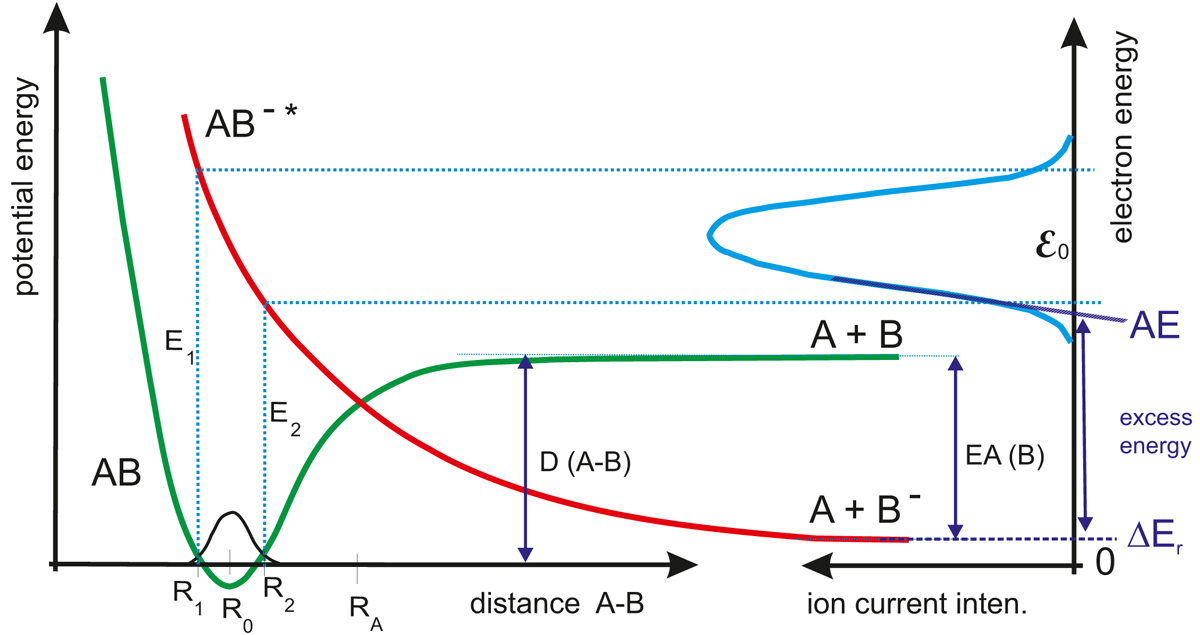
Schematic potential energy diagram illustrating the formation and dissociation of the TNI. In addition, the resulting ion yield as function of initial electron energy is shown on the right hand side (see text for detailed explanation). In a more advanced description of the DEA process also autodetachment from the TNI, which is possible up to the distance RA between A and B−, is taken into account. This leads to a slight shift of the peak maximum toward lower energies.
Current usage metrics show cumulative count of Article Views (full-text article views including HTML views, PDF and ePub downloads, according to the available data) and Abstracts Views on Vision4Press platform.
Data correspond to usage on the plateform after 2015. The current usage metrics is available 48-96 hours after online publication and is updated daily on week days.
Initial download of the metrics may take a while.