Fig. 7
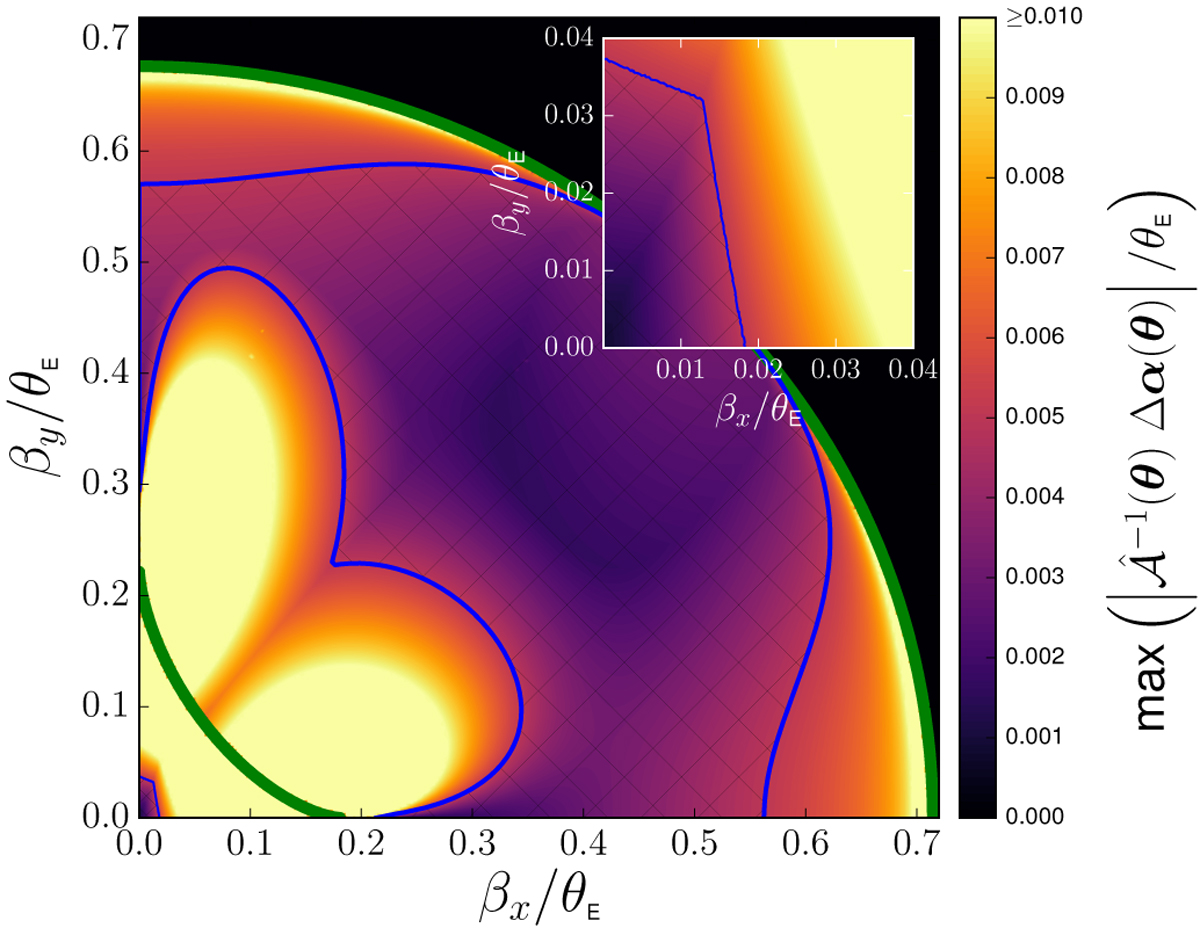
Map of |Δθ(β)|max in units of θE for f2 = 0.4 and γp = 0.1 (see Eq. (42)). The inner (resp. outer) green line represents the tangential (resp. radial) caustic curve. The two hatched regions (B1 and B2) delimited by blue curves demarcate parts of the source plane where |Δθ(β)|max ≤ 5 × 10⁻³ θE. The region B1 lies inside the tangential caustic curve while B2 lies outside. The inset highlight the region around the position β = 0.
Current usage metrics show cumulative count of Article Views (full-text article views including HTML views, PDF and ePub downloads, according to the available data) and Abstracts Views on Vision4Press platform.
Data correspond to usage on the plateform after 2015. The current usage metrics is available 48-96 hours after online publication and is updated daily on week days.
Initial download of the metrics may take a while.