Fig. 5
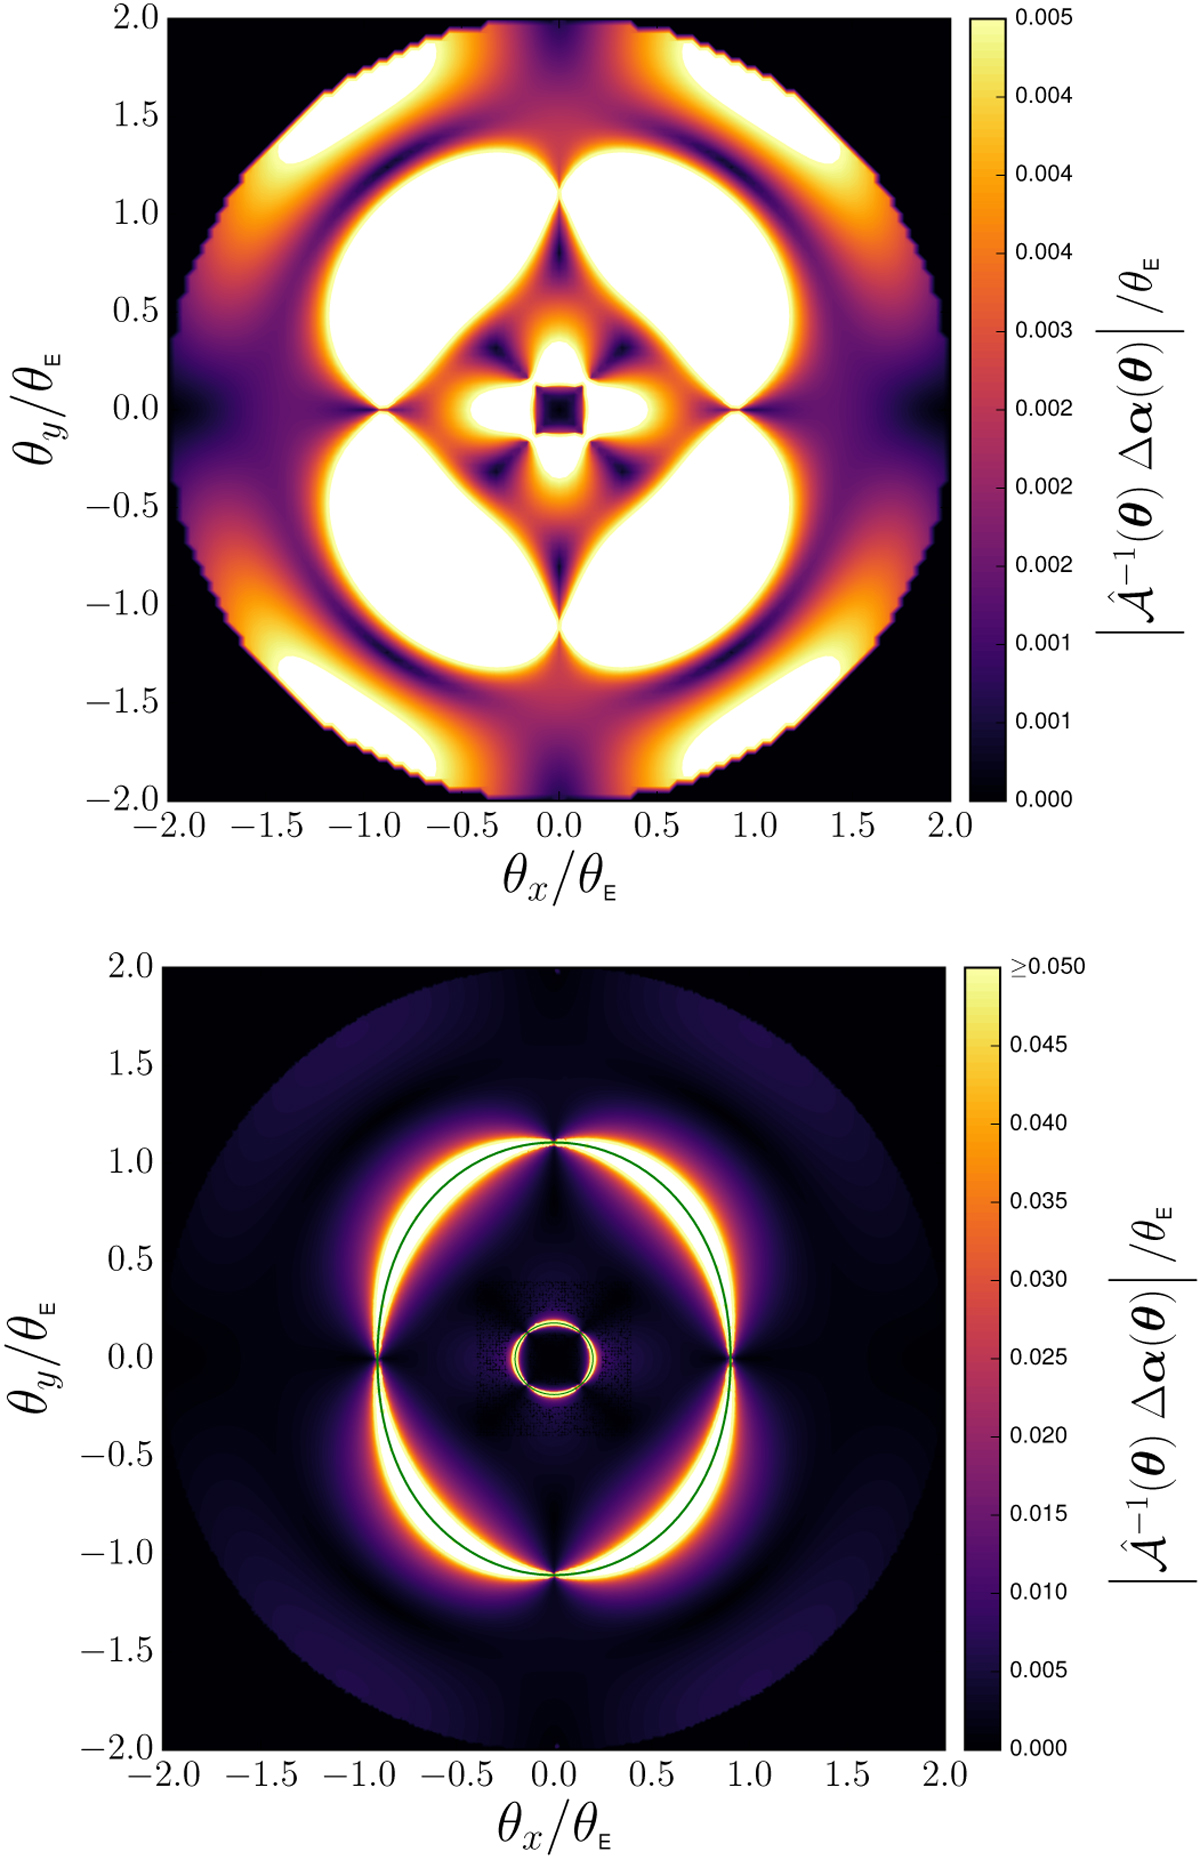
Maps of ![]() in units of θE for f2 = 0.4 and γp = 0.1. Top panel: we use the same color-coding as in Fig. 3 to explicitly show that |Δ α (θ)| < 5 × 10⁻³ θE over a region of the lens plane does not guarantee the image offsets |Δθ| to be smallerthan 5 × 10⁻³ θE over the same region. Bottom panel: we adjust the color-coding to bring out regions where the image offsets |Δ θ | are the largest, namely the critical curves.
in units of θE for f2 = 0.4 and γp = 0.1. Top panel: we use the same color-coding as in Fig. 3 to explicitly show that |Δ α (θ)| < 5 × 10⁻³ θE over a region of the lens plane does not guarantee the image offsets |Δθ| to be smallerthan 5 × 10⁻³ θE over the same region. Bottom panel: we adjust the color-coding to bring out regions where the image offsets |Δ θ | are the largest, namely the critical curves.
Current usage metrics show cumulative count of Article Views (full-text article views including HTML views, PDF and ePub downloads, according to the available data) and Abstracts Views on Vision4Press platform.
Data correspond to usage on the plateform after 2015. The current usage metrics is available 48-96 hours after online publication and is updated daily on week days.
Initial download of the metrics may take a while.