Fig. 4
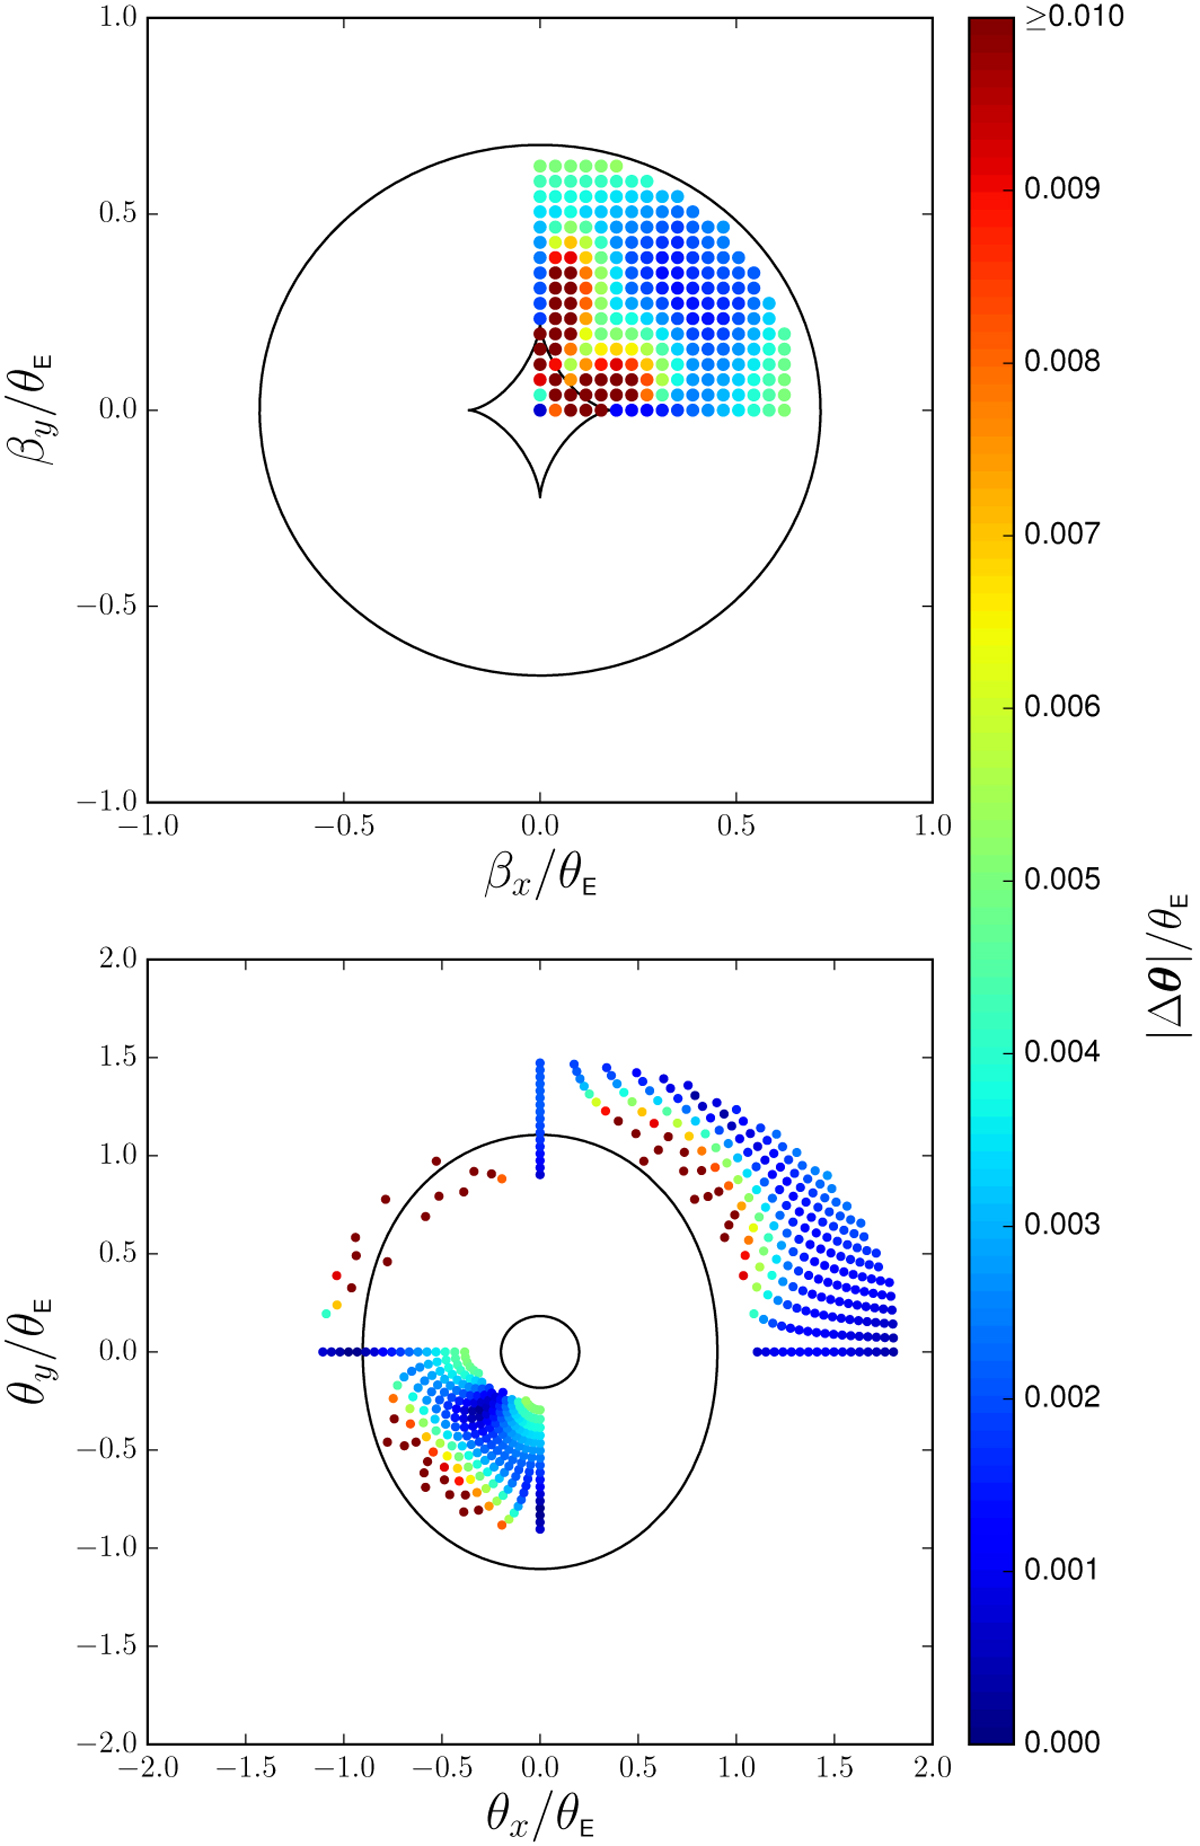
Top panel: grid of source positions β covering the radial range 0 ≤|β|≤ 0.66 θE in the first quadrant of the source plane. Each source produces a set of lensed images θ (shown in the bottom panel) under the original deflection law α and the corresponding set of ![]() under the curl-free deflection law
under the curl-free deflection law ![]() . The color-coding refers to the largest offset |Δθ|max associated with each source. The solid black curves locate the caustic curves (top panel) and the critical curves (bottom panel), respectively, for the NIS plus external shear. Bottom panel: set of mock lensed images θ produced by the source positions shown in the top panel and lensed by an NIS plus external shear characterized by θc = 0.1 θE and γp = 0.1. The color-coding represents the offsets |Δθ| in units of θE between θ and the images
. The color-coding refers to the largest offset |Δθ|max associated with each source. The solid black curves locate the caustic curves (top panel) and the critical curves (bottom panel), respectively, for the NIS plus external shear. Bottom panel: set of mock lensed images θ produced by the source positions shown in the top panel and lensed by an NIS plus external shear characterized by θc = 0.1 θE and γp = 0.1. The color-coding represents the offsets |Δθ| in units of θE between θ and the images ![]() .
.
Current usage metrics show cumulative count of Article Views (full-text article views including HTML views, PDF and ePub downloads, according to the available data) and Abstracts Views on Vision4Press platform.
Data correspond to usage on the plateform after 2015. The current usage metrics is available 48-96 hours after online publication and is updated daily on week days.
Initial download of the metrics may take a while.