Free Access
Fig. 3
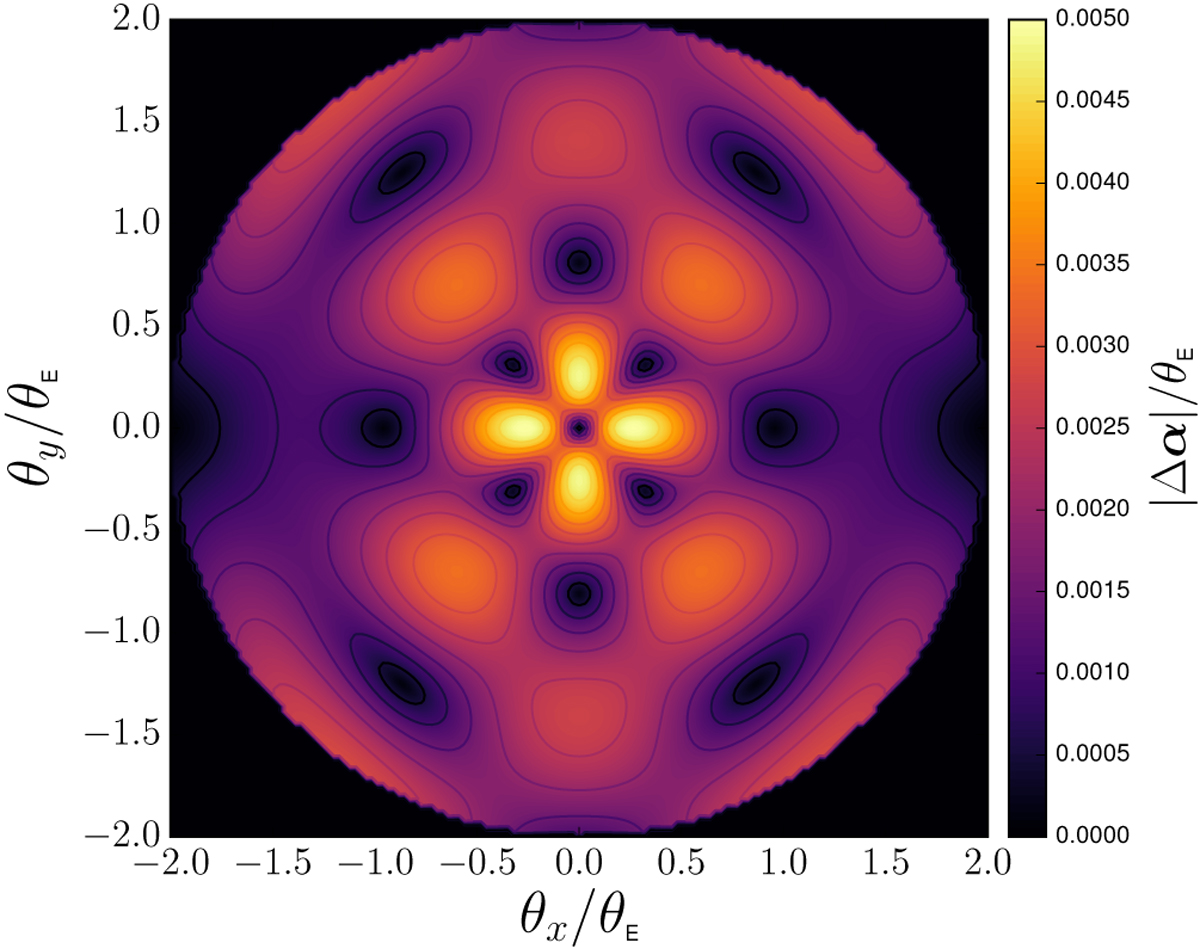
Map of |Δα(θ)| over the circular region |θ|≤ 2 θE for f2 = 0.4, θc = 0.1 θE, and γp = 0.1. This figure issimilar to Fig. 7 in Unruh et al. (2017) with f2 = 0.55, even thoughit is based on a different approach (see the text for more details).
Current usage metrics show cumulative count of Article Views (full-text article views including HTML views, PDF and ePub downloads, according to the available data) and Abstracts Views on Vision4Press platform.
Data correspond to usage on the plateform after 2015. The current usage metrics is available 48-96 hours after online publication and is updated daily on week days.
Initial download of the metrics may take a while.