Free Access
Fig. 2
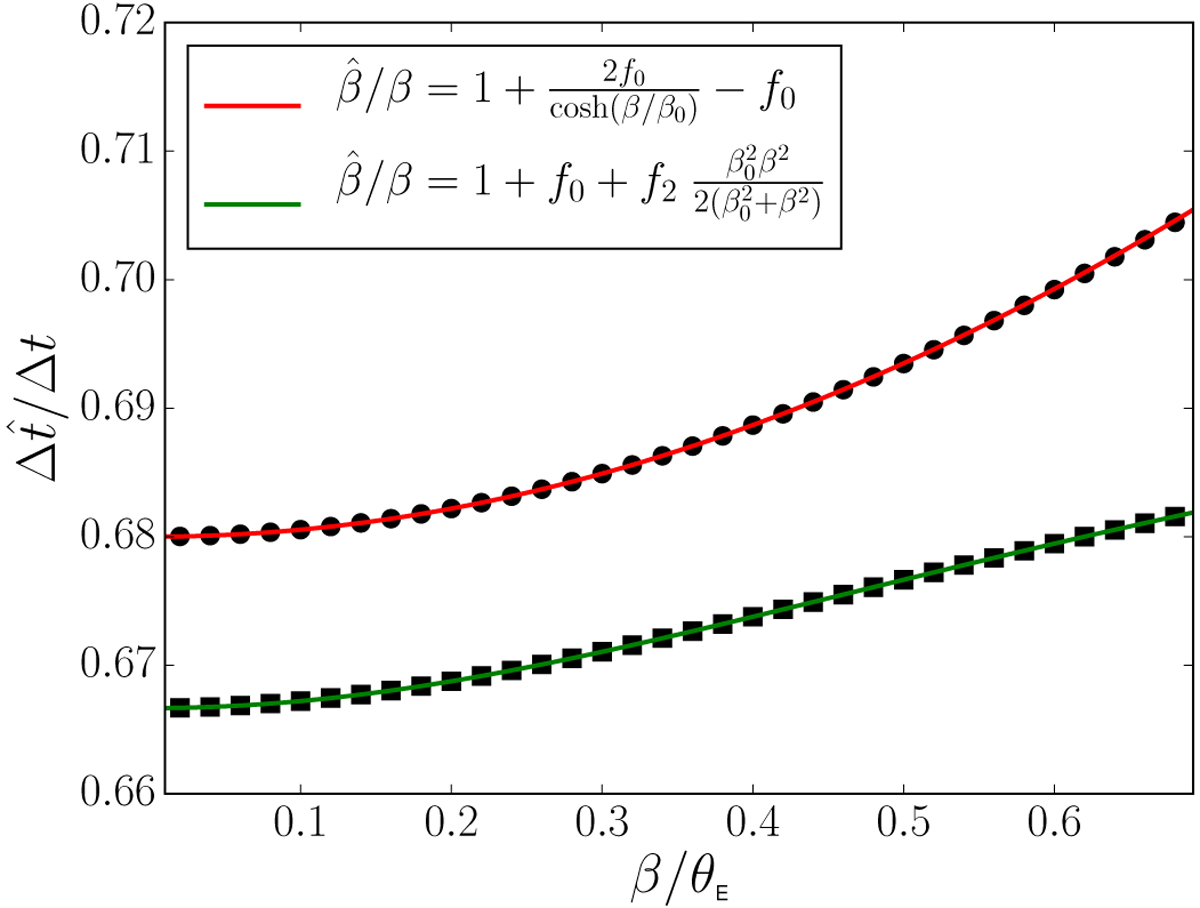
Impact on time delays of two different SPTs defined such that the corresponding
![]() is approximately a power law near the tangential critical curve. As predicted by Eq. (29), the time delay ratios (black dots and squares) scale almost perfectly like
is approximately a power law near the tangential critical curve. As predicted by Eq. (29), the time delay ratios (black dots and squares) scale almost perfectly like
![]() (red and green curves).
(red and green curves).
Current usage metrics show cumulative count of Article Views (full-text article views including HTML views, PDF and ePub downloads, according to the available data) and Abstracts Views on Vision4Press platform.
Data correspond to usage on the plateform after 2015. The current usage metrics is available 48-96 hours after online publication and is updated daily on week days.
Initial download of the metrics may take a while.