Fig. B.1
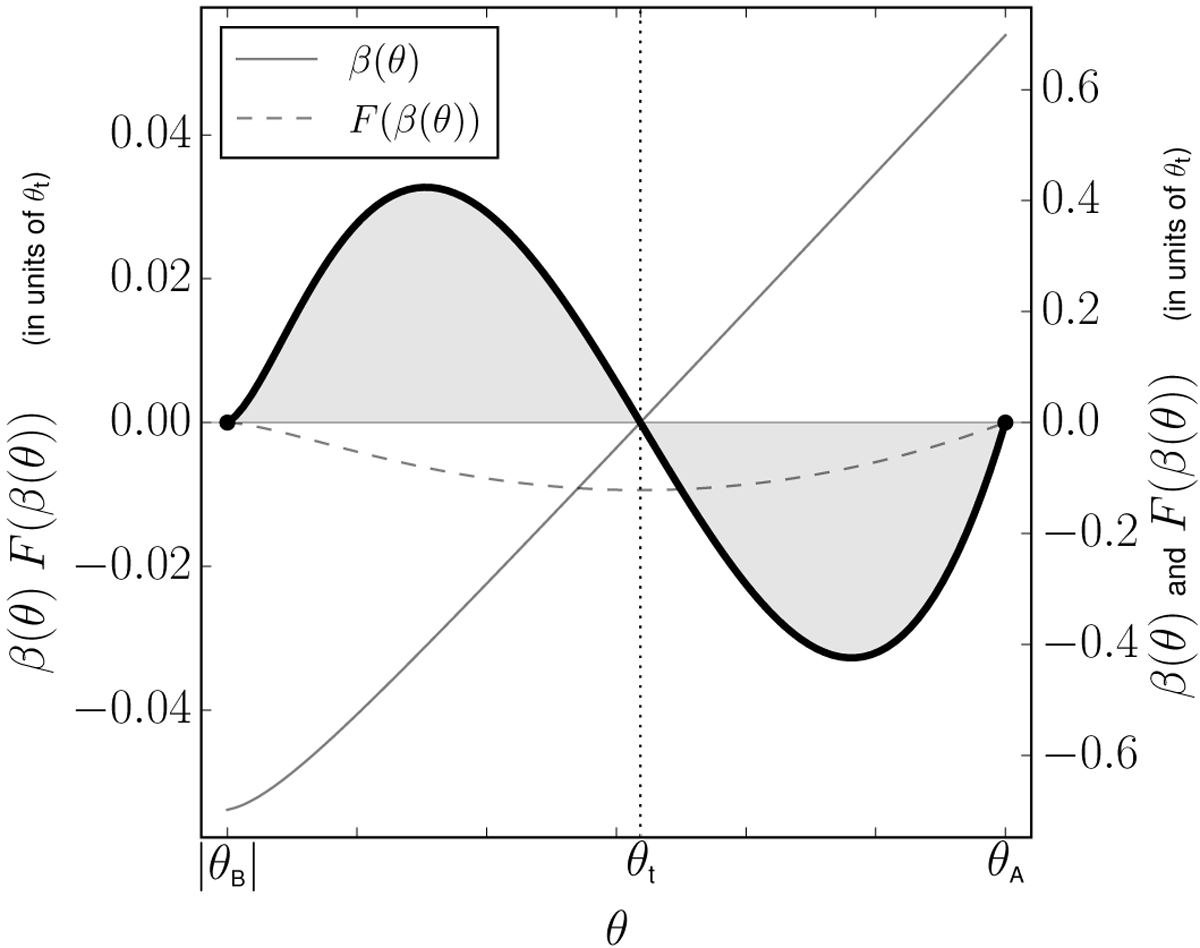
Graph of the integrand β(θ)F(β(θ)) (thick black curve) defined in Eq. (28) for the “unfavorable” case |θB | → θr. This integrand is composed of the functions β(θ) (solid gray curve) and F(β(θ)) (dashed graycurve). The (almost) symmetrical graph of β(θ) with respect to (θt, 0) and F(β(θ)) with respect to the axis θ = θt (dotted vertical line) implies the (almost) symmetry of the integrand with respect to (θt, 0). As a consequence, the two gray areas (almost) compensate each other implying that |εAB | ≪ θt, hence |ηAB|≪ 1, and confirms the validity of the Eq. (29).
Current usage metrics show cumulative count of Article Views (full-text article views including HTML views, PDF and ePub downloads, according to the available data) and Abstracts Views on Vision4Press platform.
Data correspond to usage on the plateform after 2015. The current usage metrics is available 48-96 hours after online publication and is updated daily on week days.
Initial download of the metrics may take a while.