Fig. 11
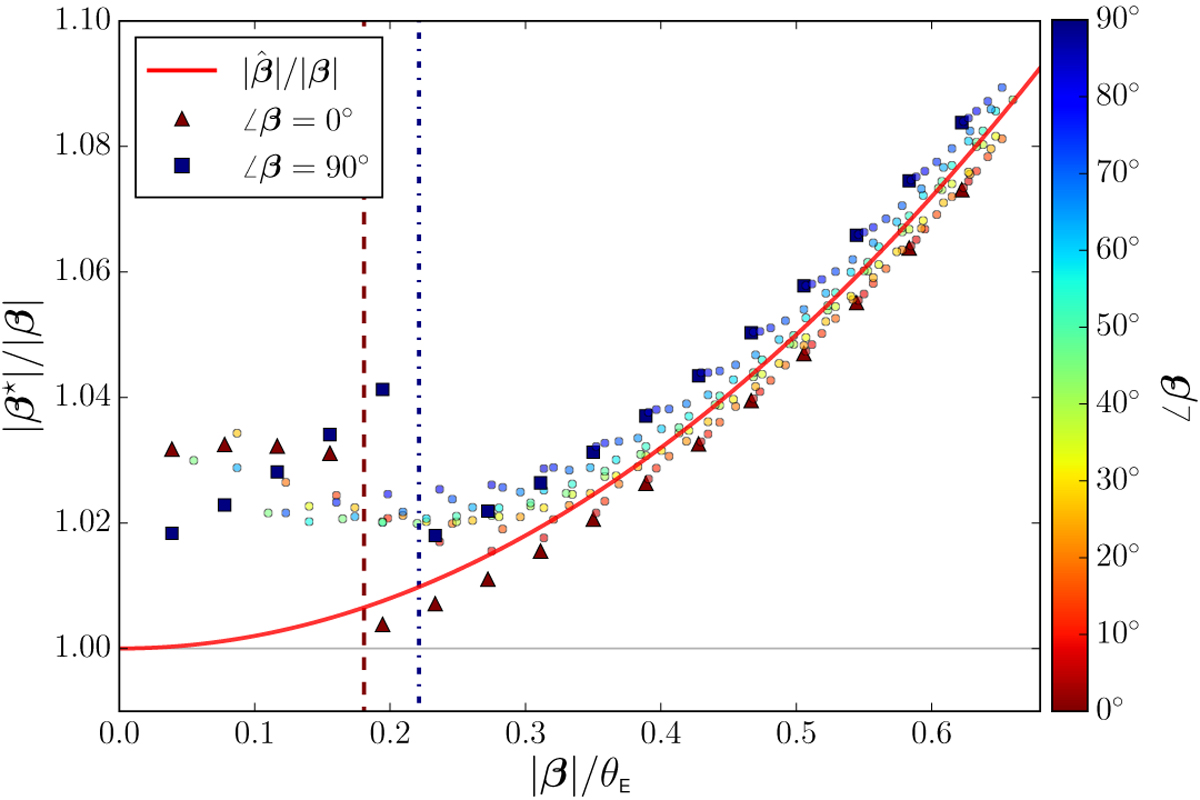
Ratios |β⋆|∕|β| plotted against β in units of θE. The source positions β⋆ are obtained by means of a numerical optimization of the cost function h(β⋆) defined in Eq. (48). The resulting source mapping β⋆(β) is slightly anisotropic: |β⋆| is larger than ![]() for ∠β > 45° and smaller for ∠β < 45°. The color-coding refers to the azimuth angle ∠β in the source plane. When a source crosses the tangential caustic curve, the mapping shows β ⋆ (β) discontinuities. Two particular jumps are highlighted: (1) sources depicted with triangles pass by the cusp located on the βx-axis (the corresponding βx∕θE is identified by the dashed vertical line); and (2) sources depicted with squares pass by the cusp located on the βy -axis (the corresponding βy∕θE is identified by the dash-dotted line.)
for ∠β > 45° and smaller for ∠β < 45°. The color-coding refers to the azimuth angle ∠β in the source plane. When a source crosses the tangential caustic curve, the mapping shows β ⋆ (β) discontinuities. Two particular jumps are highlighted: (1) sources depicted with triangles pass by the cusp located on the βx-axis (the corresponding βx∕θE is identified by the dashed vertical line); and (2) sources depicted with squares pass by the cusp located on the βy -axis (the corresponding βy∕θE is identified by the dash-dotted line.)
Current usage metrics show cumulative count of Article Views (full-text article views including HTML views, PDF and ePub downloads, according to the available data) and Abstracts Views on Vision4Press platform.
Data correspond to usage on the plateform after 2015. The current usage metrics is available 48-96 hours after online publication and is updated daily on week days.
Initial download of the metrics may take a while.