Fig. 1
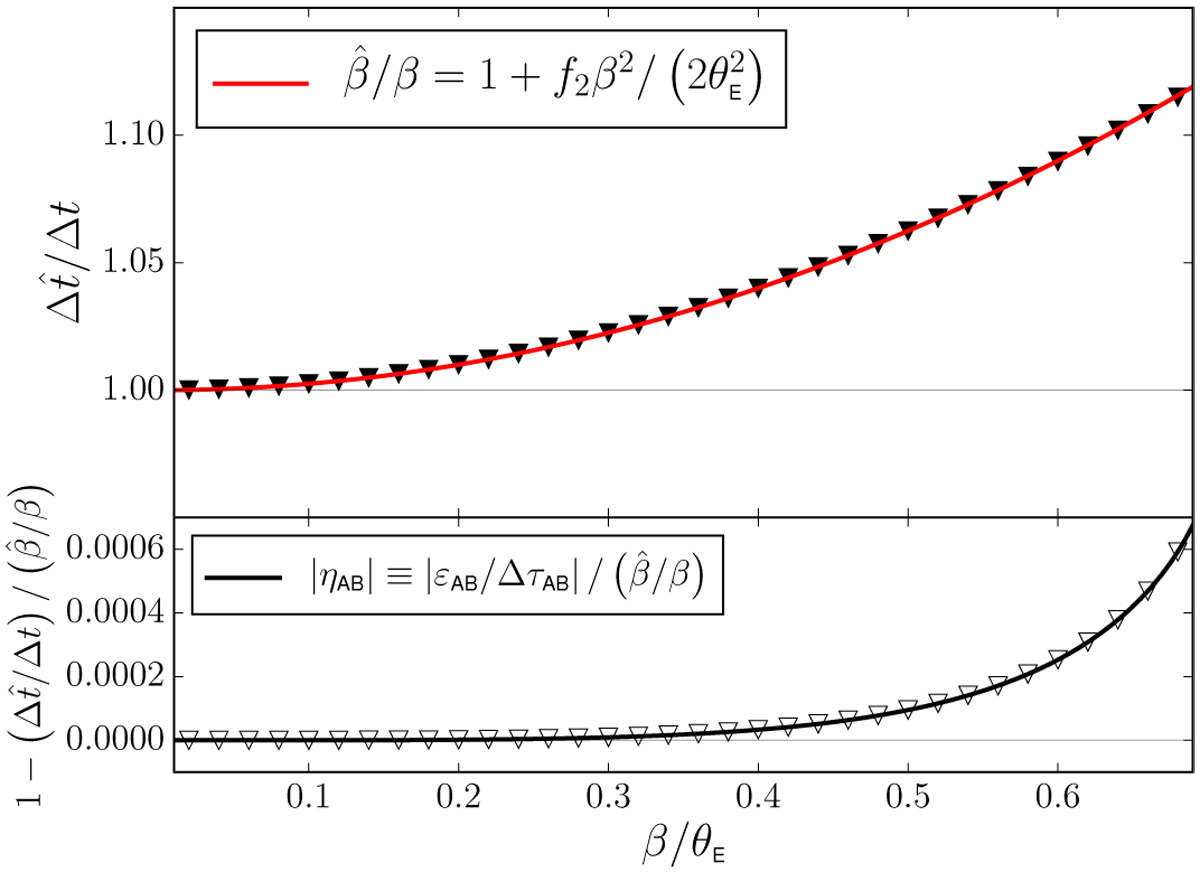
Impact of an SPT described by the radial stretching ![]() , with f2= 0.5, on time delays image pairs generated by a NIS, with core θc = 0.1 θE. Top panel: ratio between SPT-modified and original time delays (black inverted triangles) for each source position. The time delay ratios scale almost perfectly like
, with f2= 0.5, on time delays image pairs generated by a NIS, with core θc = 0.1 θE. Top panel: ratio between SPT-modified and original time delays (black inverted triangles) for each source position. The time delay ratios scale almost perfectly like
![]() (red curve), as predicted by Eq. (29). Bottom panel: numerical confirmation of the validity of the approximation performed in Eq. (29) which consists in neglecting the term εAB. The solid black curve illustrates |ηAB| as an analytical function of β and perfectly fits the quantity
(red curve), as predicted by Eq. (29). Bottom panel: numerical confirmation of the validity of the approximation performed in Eq. (29) which consists in neglecting the term εAB. The solid black curve illustrates |ηAB| as an analytical function of β and perfectly fits the quantity ![]() numerically evaluated for each source position.
numerically evaluated for each source position.
Current usage metrics show cumulative count of Article Views (full-text article views including HTML views, PDF and ePub downloads, according to the available data) and Abstracts Views on Vision4Press platform.
Data correspond to usage on the plateform after 2015. The current usage metrics is available 48-96 hours after online publication and is updated daily on week days.
Initial download of the metrics may take a while.