Fig. 7
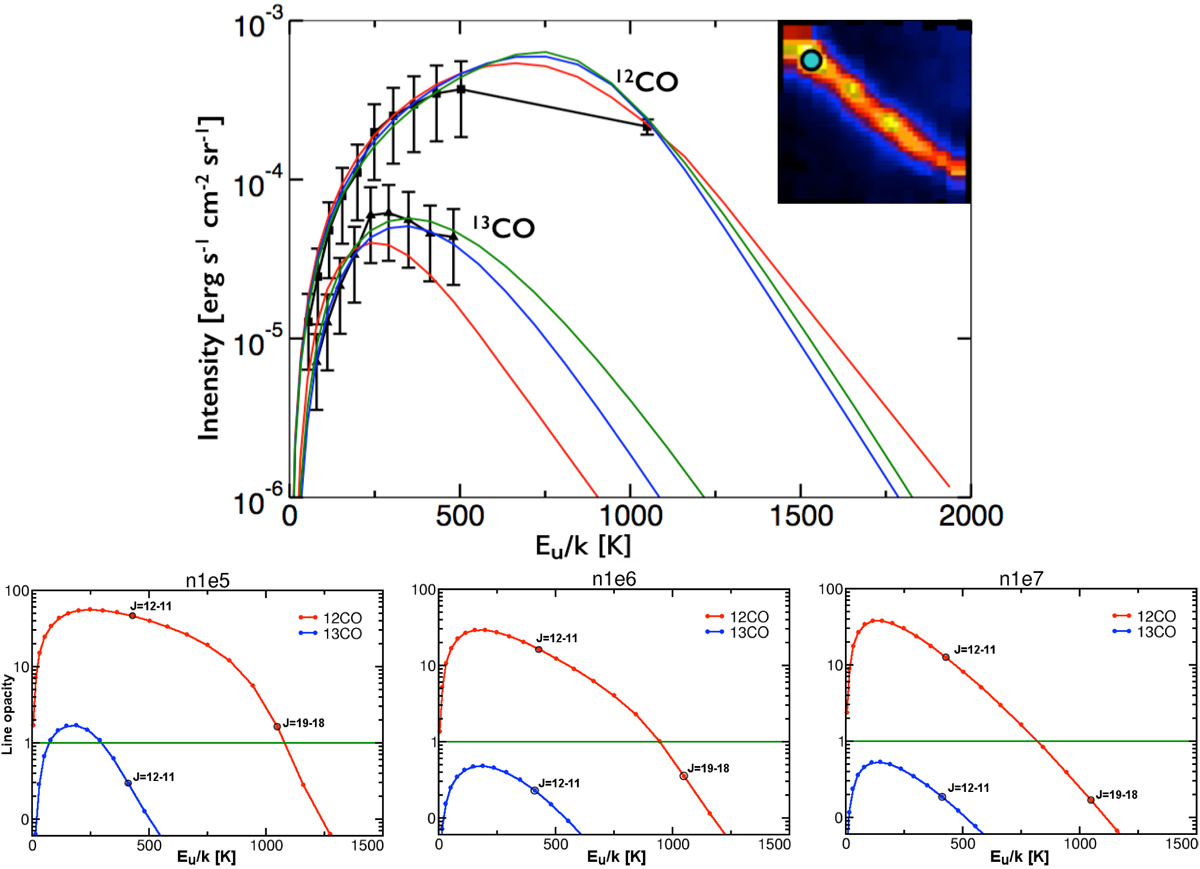
Top panel: integrated line intensities of 12CO observationsfrom J = 5−4 to J = 13−12 and J = 19–18 (black squares) and 13CO observationsfrom J = 5−4 to J = 13−12 (black triangles) are plotted against the upper energy levels of the transitions. The colored lines are the different RADEX fits for different hydrogen densities (nH): 105 (red), 106 (blue), and 107 (green).The results of the fits are shown in Table 2. Bottom panels: optical depth plotted against the upper level energy for the best fits for each hydrogen density show in the top figure.
Current usage metrics show cumulative count of Article Views (full-text article views including HTML views, PDF and ePub downloads, according to the available data) and Abstracts Views on Vision4Press platform.
Data correspond to usage on the plateform after 2015. The current usage metrics is available 48-96 hours after online publication and is updated daily on week days.
Initial download of the metrics may take a while.