Fig. 5
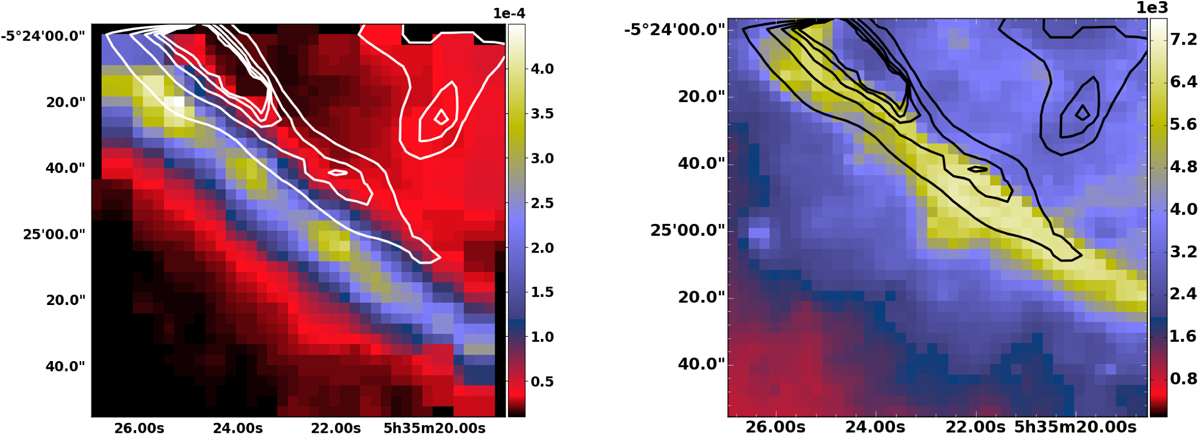
Contours of CO J = 19–18/CO J = 12–11 ratio overplotted on the CO J = 19–18 emission (left panel). The contours of CO J = 19–18/CO J = 12–11 intensity ratio overplotted on the IRAC 8 μm (right panel). The CO J = 19–18 line intensities are in units of erg s−1 cm−2 sr−1 and the 8 μm intensities are in units of MJy sr−1. The contours are separated by 1 and cover ratios from 1 to 5.
Current usage metrics show cumulative count of Article Views (full-text article views including HTML views, PDF and ePub downloads, according to the available data) and Abstracts Views on Vision4Press platform.
Data correspond to usage on the plateform after 2015. The current usage metrics is available 48-96 hours after online publication and is updated daily on week days.
Initial download of the metrics may take a while.