| Issue |
A&A
Volume 617, September 2018
|
|
|---|---|---|
| Article Number | A59 | |
| Number of page(s) | 11 | |
| Section | Extragalactic astronomy | |
| DOI | https://doi.org/10.1051/0004-6361/201731953 | |
| Published online | 18 September 2018 | |
CTA 102 in exceptionally high state during 2016–2017
1
Astronomy & Astrophysics Division, Physical Research Laboratory, 380009 Ahmedabad, India
e-mail: This email address is being protected from spambots. You need JavaScript enabled to view it.
; e-mail: This email address is being protected from spambots. You need JavaScript enabled to view it.
2
Indian Institute of Technology, Gandhinagar, 382355 Gujarat, India
Received:
14
September
2017
Accepted:
29
May
2018
Abstract
Blazars in outburst provide a unique opportunity to study their spectral behavior, correlated variations at different frequencies, and jet structure. An unprecedented flaring activity in FSRQ CTA 102, occuring from 2016 November to 2017 January, is used here for a detailed study to understand flaring mechanisms at short and long timescales, spectral behavior in different energy regimes, and to estimate sizes and location of the high-energy emitting region in the jet. Multiwavelength (MW) data for CTA 102 during its outburst period, were obtained from Fermi-LAT, Swift-XRT/UVOT, Steward Observatory, Mt Abu Infrared Observatory, and OVRO. These were analyzed to construct MW light curves, extract the spectral information, and to perform the correlated variability studies. Our study shows that CTA 102 attained the highest ever flux levels across the electromagnetic spectrum (EMS) while flaring and otherwise, with rapid and prolonged activities at all the frequencies. A number of short-term (three to eight days) and long-term (more than a month) variability events are noticed across the EMS. We infer a redder when brighter trend in faint state and a bluer when brighter trend during a few optical flares. Based on the flux doubling timescale, the size of γ-ray emitting region is estimated as ≈8.76 × 1015 cm, located at a distance of about 5.58 × 1016 cm from the central engine. CTA 102 was in extremely bright phase during 2016–2017, possibly due to, successive high energy particle injections into the jet, creating shocks traveling down the jet which lead to the overall flux enhancement across the EMS. Alternatively, a decreasing viewing angle could also lead to such flux enhancement. The study reveals correlated variations in all the energy bands, with lags within time bins, indicating co-spatial origin of the emissions. During the flaring event, a bluer-when-brighter color in the optical and harder when brighter trend in the X-ray and γ-ray spectra are noticed. During some flares softer γ-ray spectra are observed.
Key words: galaxies: active / galaxies: jets / gamma rays: galaxies / radiation mechanisms: non-thermal / techniques: photometric / methods: observational
© ESO 2018
1. Introduction
Flat spectrum radio quasar (FSRQ), CTA 102 (also called PKS J2232+114, 4C11.69), at the redshift 1.037 (Paturel et al. 2002) has been observed across the electromagnetic spectrum (EMS) extensively (Osterman Meyer et al. 2009, and references therein). Its first detection in γ-rays was by the EGRET instrument on-board the Compton Gamma-Ray Observatory (Nolan et al. 1993). Tornikoski et al. (1999) reported a simultaneous flare in optical and radio (90 GHz) in CTA 102 during 1997, while only the optical flare occurred in 1996. The detection of optical variability and the optical-IR correlated emissions, during the high-flux state of the source, were reported by Raiteri et al. (1998) and Bach et al. (2007), respectively. Osterman Meyer et al. (2009) detected the optical micro-variability (about 15 m timescale), with more than 2 mag day−1 rate of change in brightness and a redder when brighter (RWB) spectral behavior during the 2004–2005 activity in the source. They also found that the variability in radio, optical and X-ray was not correlated, in line with the findings by Osterman Meyer et al. (2008) for the FSRQ PKS 1622-297 and Clements et al. (1995) for a number of FSRQs. These results indicate that different emissions in the jet dominate at different epochs. However, a strong correlation between γ-ray and optical flaring events in CTA 102 was reported by Cohen et al. (2014) with γ-ray leading the optical by about 11 days, suggestive of the leptonic origin of high energy γ-rays. The total flux and spectral study by Williamson et al. (2014) found CTA 102 in 12 periods of quiescence, seven of active, and four periods of γ-ray flaring state during 2008–2012. The source witnessed small scale variation in its early (1973–1987) history when it was rather faint with an average B-band brightness of 17.7 mag, which increased by more than three magnitude during the 2004 outburst, peaking with R = 14.5 mag on 2004 October (Osterman Meyer et al. 2009). The WEBT campaign (Larionov et al. 2016) during the 2012 huge outburst in CTA 102 captured the source in its, at that time, highest flux levels across the spectrum (e.g. R brighter than 13.5 mag, Fγ = 8.2 × 10⁻⁶ ph cm−2 s−1). A co-spatial origin of the optical and γ-ray emissions was inferred as the study revealed strong correlated variation in the two energy regimes without any lag. Casadio et al. (2015) used multiwavelength data, including 43 GHz VLBA images, and found that the correlated optical and γ-ray flaring occurred at more than 12 pc away from the central source.
Recently, CTA 102 underwent unprecedented activity in all the EMS bands during 2016–2017 (Bulgarelli et al. 2016; Verrecchia et al. 2016; Carrasco et al. 2016; Ciprini & Verrecchia 2016; Bachev et al. 2017; Raiteri et al. 2017, etc.), significantly surpassing 2012 flare levels and, therefore, attracted lot of attention. The enhanced activity first started in optical, reaching R = 14.33 mag on 2016 June 8 (Larionov & Kopatskaya 2016), while the IR fluxes significantly increased showing J = 9.97 mag (Carrasco et al. 2016), which was more than 2 mag brighter than that recorded by Larionov et al. (2016) during 2012 flare. Bachev et al. (2017) addressed intra-night optical variations in blazar CTA 102 during the two extreme outbursts, in 2012 and 2016, and found change in the brightness by a few tenths of a magnitude on a timescale of a few hours. The fastest variation was noticed within 30 min, resulting in a brightness change by 0.2 mag in R band. The multiband optical light curves indicated a strong correlation with out any significant time lag. Zacharias et al. (2017) explained the high energy emission during prolonged 2016 outburst in CTA 102 on the basis of a gas cloud entering and leaving the relativistic jet, causing ablation of the gas and hence gradual increase in the emissions across the EMS. They put a cut off limit on the IC component at ≈20 GeV. Raiteri et al. (2017) discussed the radio to optical emissions in CTA 102 during the 2016–2017 outburst and explained the variations by invoking an inhomogeneous, curved jet model leading to changes in the viewing angle and Doppler boosting. They also reported emission at 37 GHz peaking much earlier than the peaks in sub-mm (230 GHz) and optical (R-band), inferring different locations for their emission. Based on the short time binning, 3 h and 3 min, Shukla et al. (2018) detected 5 min variability timescale during the 2017 April flare in CTA 102, making it one of the very few blazars to show such extreme variability event in high energy γ-rays.
In several recent works, strong correlation between optical and high energy γ-rays has been noticed in a number of blazars, particularly FSRQs, detecting no or short time lags with γ-ray leading the optical or vice-versa (Bonning et al. 2009; Raiteri et al. 2011; Vercellone et al. 2009; Jorstad et al. 2013). Using the high energy γ-ray data from Fermi and quasi-simultaneous optical data, on more than 40 blazars, Cohen et al. (2014) studied the correlation between two fluxes. They found that, in general, FSRQs show high energy emission leading the lower one with a time lag of one to ten days. The behavior of intermediate (IBL) and high frequency (HBL) blazars was not that clear, showing small lags or leads. Based on the strong correlation between low and high energy emission for many sources, one zone leptonic models were suggested for the emission. CTA 102 has shown complex nature of correlated variations in radio, optical and x-rays during its 2004–2005 (Osterman Meyer et al. 2009) and 2012 (Larionov et al. 2016; Raiteri et al. 2017) high states. While no significant correlation was seen during 2004, strong correlation was noticed in 2012, also, a significant enhancement at 37 GHz met with quiescent behavior in optical during 2008–2009. Since it is difficult to understand the multiband emission behavior of these sources when in low phase, outbursts provide opportunity to study correlated variations between various EMS regimes and to study the structure of the relativistic jet (Raiteri et al. 2012; Marscher et al. 2010).
In this paper, we present a multiwavelength investigation of the blazar CTA 102 in its brightest phase in radio, optical, UV, X-ray and γ-ray energy bands, during 2016–2017 and try to understand its variability behavior. Sect. 2 reports multiwavelength observations and data analysis, Sect. 3 discusses the results and finally, Sect. 4 concludes the present study.
2. Multiwavelength observations and data analysis
2.1. Fermi-LAT observations
The LAT is a pair-production telescope onboard the Fermi satellite (Atwood et al. 2009) with a large effective collection area (≃6500 cm2 on axis for 1 GeV photons) and a large field of view (2.4 sr), sensitive in the energy range 20 MeV to 300 GeV. The field of view of the LAT covers about 20 per cent of the sky, and maps whole sky every 192 min. The Fermi-LAT data for the duration 2016 November 1 (MJD 57693) to 2017 January 21 (MJD 57774) were analyzed using ScienceTools software package(version v10r0p5). In our case, we have used the most appropriate event class as 128 with event type 3 (for point and mildly extended sources as suggested by Fermi-LAT analysis team), to analyze the data on the medium to longer timescales. Using the gtselect tool, we have extracted the photon class events (i.e., PASS 8 SOURCE) lying within the region of interest(ROI) of 10°, zenith angle < 100°, energy range between 0.1 and 300 GeV. The gtlike tool was used to re-construct the source energy spectrum, using maximum likelihood analysis, and the background model was constructed using 3FGL catalog (gll_psc_v16.fit). The source spectrum was generated using a simple power-law model while we used gll_iem_v06.fits and iso_P8R2_SOURCE_v6_v06.txt to model the Galactic diffuse emission and the isotropic emission component, respectively. The Fermi-LAT data has been reduced using the publicly available Python package, Enrico (Sanchez & Deil 2013).
We used the temporal binning of one day and six hours to three hours, for the whole period (MJD 57693 to MJD 57774) and the major γ-ray flares (on MJD 57751 and MJD 57760, for sub-hour variability) respectively. The temporal analysis with shorter time bins is constrained by the limited number of photons when source is not bright enough to be detected. Fortunately, in case of CTA 102 under current unprecedented outburst phase, we had best possible photon statistics (measured by the test statistics parameter, TS = 2(log L1–log L0), where L1 & L0 are the likelihood of the data given the model with or without the source, respectively), enabling us to use shorter time bins. We generated the light curves (lcs) using 3 h (TS > 40) and 6 h (TS > 135) during the two major flares, and one day binning (1650 < TS < 10.5), with more than 3σ confidence level, for the whole duration of observations used here, including quiescent phase as well.
2.2. Swift X-ray, UV, and optical observations
We used Swift-XRT publicly available data from HEASARC database1 in the energy range 2–10 keV for the period from 2016 November 14 to 2017 January 18. The data were processed using HEASOFT package version 6.20. The standard xrtpipeline v.0.13.0 was used to calibrate the data following the defined analysis steps2. The source and background spectra were extracted using xselect tool and the pile-up corrections were applied in a few cases when the source was extremely bright. The obtained spectra is fitted with a simple power-law model in XSPEC and the fluxes were calculated, using column density, nH = 5.0 × 1020 cm−2 (Dickey & Lockman 1990).
The Swift satellite is a multiwavelength observatory that provides the simultaneous data in optical (U: 345 nm; B: 439 nm; V: 544 nm) and ultra-violet bands (UVW2: 188 nm; UVM2: 217 nm; UVW1: 251 nm). We used the Swift-UltraViolet Optical Telescope (UVOT; Roming et al. 2005) data for a period of 2016 November 14 to 2017 January 18, which were reduced using HEASOFT package. Multiple exposures in the same filter at same epoch were summed with uvotimsum and aperture photometry was done with the uvotsource task. The details of the analysis procedure are given by Kaur et al. (2017a) and Chandra et al. (2015).
2.3. Optical observations from MIRO
We monitored the source CTA 102 on a total of eight nights in December 2016, beginning on December 18, when it was undergoing unprecedented outburst across all energy regimes. The optical broadband filters (B, V, R & I) were used to carry out high temporal resolution (30–50 s per exposure) observations from the Mount Abu InfraRed Observatory (MIRO) telescope facility – 1.2 m telescope equipped with ANDOR CCD camera with 2048 × 2048 pixels (for details about the instruments and detector used, see, Kaur 2017; Kaur et al. 2017b). The standard procedures were followed to reduce and analyze the data for the source and available field stars. Their instrumental magnitudes were calculated to generate differential light curves for the source – comparison star, and, control star – comparison star, in order to determine the existence of any short-term (intra-day) variability. On the average, the photometric errors in R-band are less than 0.006 mag.
2.4. Steward optical observatory data
We also used the optical V-band data and polarization data (DP: Degree of polarization and PA: Position angle) from the public archive at Steward Observatory, Arizona (Smith et al. 2009)3. This data was available only for the duration from 2016 November 3 to 2017 January 13 for CTA 102.
2.5. Radio data at 15 GHz from OVRO
The radio fluxes for CTA 102, at 15 GHz, from Oven’s Valley Radio Observatory (OVRO)4 were obtained during the period MJD 57695–57768. The observatory, using a 40 m single dish centered at 15 GHz, regularly monitors a sample of 1700 γ-ray bright blazars, including the sources from Candidate Gamma-Ray Blazar (CGRaBS) and Fermi-AGN catalogs. Each source was monitored twice a week with the typical flux error of 4 mJy and ≈3% uncertainty from pointing errors and other systematic effects (Richards et al. 2011).
3. Results and discussion
Figure 1 presents the multiwavelength light curve (MWLC) for CTA 102 during 2016 November 1–2017 January 21. The time in MJD is plotted along X-axis while the respective brightness fluxes/magnitudes are along Y-axis. The top panel in Fig. 1 shows the γ-ray flux (in ph cm−2 s−1), using one day (1d) binning, with an average flux of 2.39 × 10⁻⁶ ph cm−2 s−1 over the period of the outburst. Second panel shows γ-ray photon index, Γγ. In the third and fourth panels we show the X-ray (2.0–10.0 keV) Swift-XRT flux (in ergs cm−2 s−1), varying between (4.81 − 0.96) × 10−11 ergs cm−2 s−1 with average flux of 2.75 × 10⁻¹¹ ergs cm−2 s−1 and X-ray photon index. The Swift-UVOT fluxes in all UV bands, W1, M2, and W2, are shown in the fifth panel while sixth panel gives the optical UBV-band magnitudes obtained from Swift-UVOT, MIRO along with Steward Observatory V-band data. Also shown is 15 GHz radio flux (in Jy) obtained from OVRO. The bottom two panels display the polarization data (DP and PA) taken from the Steward Observatory. Some of the features are common in all the light curves but for more clarity a correlation study is performed between fluxes in various energy regimes using statistical technique zDCF described by Alexander (2014). The correlation plots are discussed later.
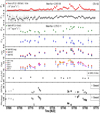 |
Fig. 1 Multiwavelength light curves for CTA 102 during the 2016 November–2017 January outburst. From top panel to bottom panel: 1d binned Fermi-LAT γ-ray flux (E > 100 MeV) followed by γ-ray photon index; X-ray (2.0–10.0 keV) flux (Swift-XRT); X-ray photon index (γ; Swift-XRT); UV-band (W1, M2, W2) magnitudes (Swift-UVOT); Swift-UVOT, MIRO and Steward Observatory optical magnitudes; 15 GHz OVRO flux; Degree of Polarization (DP%) and position angle, PA, in degrees (Steward Observatory). |
The γ-ray light-curve shows very interesting features, particularly during outbursts with multiple prominent flares superposed on these outbursts. Therefore, for more clarity we plot γ-ray (Fermi–LAT) light curve in a separate figure (Fig. 2), with time in MJD and 1d binned flux in ph cm−2 s−1 units. During this period (2016 November 1–2017 January 21), the average γ-ray flux (2.39 × 10⁻⁶ ph cm−2 s−1) is more than 300 times of that listed in 2FGL catalog, which is about 2.9 ± 0.2 × 10⁻⁹ ph cm−2 s−1 (Nolan et al. 2012). To estimate the duration of outburst, we have to first define the outburst. We refer to the source as being in outburst phase if the γ-ray flux calculated with one-day binning within the γ-ray energy range 0.1–300 Gev is larger than 2.0 × 10⁻⁶ ph cm−2 s−1. It leads to the detection of a big flare at about MJD 57714, lasting just three days with a peak flux of 2.5 × 10⁻⁶ ph cm−2 s−1 and the main outburst which started at MJD 57735, with a peak flux of 6 × 10⁻⁶ ph cm−2 s−1, which continued for about next thirty days. The strongest flare during the outburst occurred on MJD = 57751, with a peak flux of 1.1 × 10⁻⁵ ph cm−2 s−1. Such strong and prolonged outburst in this source is unprecedented and contributes enormous power to the overall energy flux of CTA 102. There are several rapid but strong flares superimposed on the already much enhanced base level flux. Interestingly, CTA 102 was so active that during the period considered here, the total flux of the source surpassed the already high average γ-ray flux level (Fγ, avg = 2.39 × 10⁻⁶ ph cm−2 s−1) at least nine times. In order to determine extent of the power content in the prominent flares, we calculated the FWHM of each flare profile and multiplied it by the duration of the flares. We found the power contained in the flare peaking at MJD 57739 to be approximately 2.25 × 10⁻⁵ ph cm−2; for the flare at MJD 57745 about 1.40 × 10⁻⁵ ph cm−2. The power contained in the major flare at MJD 57751, is 3.0 × 10⁻⁵ ph cm−2 while for another major flare at MJD 57760, it is 2.25 × 10⁻⁵ ph cm−2. The source has not experienced such strong flare with so much power in its entire history.
 |
Fig. 2 γ-ray light curve of FSRQ CTA 102 showing flaring activity during November 2016–January 2017. Time in MJD is plotted along X-axis and flux along Y-axis. The gray dashed line shows the average flux level. |
3.1. Multiwavelength light curves
As clearly seen in Fig. 1, the average fluxes of γ-rays and X-rays are already substantially elevated and any activity over and above these levels represent a significant enhancement on their past historical flux values. We note that CTA 102 remained very active across all the energies considered here and exhibited a range of almost symmetric γ-ray flares, spanning from three to eight days, with significantly high flux levels. At lower energies (UV and optical), an outburst (greater than one month), superposed by several flares of a few days duration, is noticed.
CTA 102 experienced a huge outburst of 70d duration, beginning MJD 57694, across EMS after being in the quiescent state for a long time. The activity started with a short γ-ray flare (3d long) on MJD 57701, followed by the next flare on 2016 November 13 (MJD 57705) showing a five fold enhancement in the flux in just 2d ( ph cm−2 s−1).
The γ-ray flare with double peaks (1d apart) peaking at MJD 57715/16 (2016 November 23/24) surpassed the average flux level. The corresponding activity at lower-energies, in other words, in optical, UV, and X-ray, also started on MJD 57712, peaking one day early (on MJD 57714), with a flux drop when γ-ray flux was at the peak (on MJD 57716). The radio 15 GHz flux peaked couple of days before that in γ-rays. Though the decay was not captured by Swift in X-ray, UV and V band, MIRO and Steward observations suggest a smooth decay making it a symmetric flare. During the decay of multi-emission flare, linear polarization increases from 5 to 10% while position angle of polarization undergoes a rotation by 145°. A blob passing through stationary core in jet could lead to such behavior. Interestingly, the radio maps from the VLBI-GLAST campaign show the ejection features from the stationary core, during November 28, 2016. This strongly indicates the clear injection of the blob into the jet leading to the flaring activity across EMS.
Around MJD 57723 (2016 December 1), the overall base level flux continued increasing slowly. While the X-ray flux was low, optical/UV fluxes got enhanced and rapid polarization changes took place (DP: 28% to 13%; PA: 165° to 127°). The changes in DP and PA during γ-ray flaring have been studied by Marscher (2014) extensively, who explained these to be associated with a blob passing through a quasi-stationary core, resulting in the significant emissions at all frequencies under shock-in-jet scenario. The blob (or shock) compresses the plasma in the dense medium of the core, aligning the magnetic field which results in change in polarization and position angle. We noticed a significant delay between optical/UV and γ-ray fluxes. The low X-ray flux could either be the victim of differential alignment of respective emission regions w.r.t. LOS (Raiteri et al. 2011), or its origin itself could be different (Cavaliere et al. 2017). Due to large data gaps in X-rays on these epochs, it is difficult to draw any definite conclusion.
A host of rapid γ-ray flares, with the “saw-tooth” features (slow rise-fast decay), are seen with peaks close to the average flux level on MJD 57727, 57731 and 57734 (2016 December 5, 9 & 12). Figure 1 clearly shows the twin γ-ray flares on MJD 57737 & 57739, with the flux levels of (5.68 ± 0.37) & (7.06 ± 0.18) × 10−6 ph cm−2 s−1, respectively. The X-ray flux increased by more than 50% relative to the flux on MJD 57736, followed by a γ-ray flare (at MJD 57337). Before the second γ-ray peak (at MJD 57739), the X-ray flux dropped by about 44%, followed by the decay in UV & optical. On MJD 57739, when the fluxes at lower energies were slowly declining, a γ-ray flare (second peak) indicates a possible orphan flare. The cause for such a flare could be up-scattering of the ambient photons at the boundary of the jet without any change in the optical flux. There are other explanations based on hadronic scenario for the high energy emission production (Böttcher 2006). MacDonald et al. (2017) explain orphan flare based on their “ring of fire”, model in which synchrotron electrons in the jet spine blob up-scatter seed photons emanating off a rind of shocked sheath plasma enshrouding the jet spine. As the emitting blob propagates through the ring, scattering of ring photons by blob creates orphan flare. It was used to explain 2011 June 11 orphan flare in CTA 102 along with such flares in 3C273, 3C279, 4C 71.07 etc.
In MJD 57740–57749 we detect a triple-flare, successive constituent flares showing increased amplitudes. Out of these, the major flare peaked at MJD 57745 (2016 December 23) with a fast rise (1d) and slow decay (4d). This flare is fit by Shukla et al. (2018) to arrive at a two-hour timescale of variation. The X-ray showed subdued activity, peaking 3d later while the optical and UV fluxes were enhanced by 1 mag & 1.7 mag, respectively. Radio (15 GHz) flux seems to have peaked two days prior to activity at higher energies. The major flares during MJD 57751 and 57760 are detailed in the following section.
3.2. Historical outburst with sub-day variability
As we noticed from Fig. 1, CTA 102 exhibited unprecedented flux levels almost across the EMS. It is accompanied by significant variations in flux at various timescales. For blazars, detection on intra-day variations have been common in the optical and near infra-red. However, the exceptionally high flux levels obtained for CTA 102 have made this source one of the very few for which it has been possible to address sub-day timescale variations in high energy domain. It is due both to the small telescope size (due to space payload limitations) and intrinsically low flux of the high energy sources. However, very fast variations have been detected with a few-minutes timescale in TeV regime for a number of sources, in general, BL Lacs (Aharonian et al. 2003, and references there in). Here we specifically discuss the variability in optical and the high energy γ-rays at intra-night timescales.
3.2.1. Optical intra-night variations
In the past, CTA 102 showed rapid variations in optical with timescales as short as 15 min to 3.6 h (Osterman Meyer et al. 2009; Raiteri et al. 1998; Bachev et al. 2017). Very recently, Zacharias et al. (2017) also claimed intra-day variability (IDV) in optical window with a brightest magnitude of 10.96 ± 0.05 in R band on 2016, December 29 (MJD 57751). We monitored the source for IDV from Mt Abu InfraRed Observatory for six nights during 2016 December and intra-day light curves for December 18, 19, 20, and 21 are shown in Fig. 3. We find CTA 102 showing IDV at more than 3-σ level, with variability timescales ranging from 10 min (December 18) to 35 min (December 20 & 21). On 2016 December 19, source shows fluctuations in the brightness which are less than 2-σ. These variability timescales are in agreement with those reported by other workers for CTA 102 (Bachev et al. 2017; Osterman Meyer et al. 2009; Raiteri et al. 2017). However, we did not detect IDV on rest of the nights monitored at MIRO, due perhaps, to shorter monitoring periods.
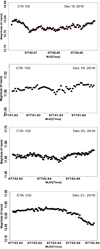 |
Fig. 3 Light curves for the intra-day brightness variability in CTA 102 in optical R-band on 2016 December 18, 19, 20 & 21. Significant (more than 3σ) IDV is noticed on December 18, 20 & 21. |
The optical observations from MIRO show that the source has undergone a significant flux variability over short timescales (day-to-day) also. We calculated the nightly averaged R-band magnitudes for CTA 102 from our observations over eight nights, beginning 2016 December 18, and the results are provided in the Table 1, where Cols. 1 and 2 represent the epoch of observations in dd-mm-yyyy format and in MJD format, respectively. Columns 3 and 4 show the number of images per night and duration of observations in minutes. The nightly averaged R-band magnitudes and their photometric errors are listed in Cols. 5 and 6, respectively.
Interestingly, CTA 102 brightened by more than a factor of 2.5 within a day, from R-band magnitude of R = 12.67 ± 0.01 (2016 December 18) to a value R = 11.55 ± 0.01 (2016 December 19), which is unprecedented in the history of this source. After that, the source brightness decreased slowly during next three days with respective magnitudes as 11.84 ± 0.01 (2016 December 20), 11.99 ± 0.01 (2016 December 21) and 11.88 ± 0.01 (2016 December 22). As per our observations on 2016 December 27, the source entered into the extreme flaring phase with a 0.6 mag enhancement from the previous day brightness value, with the nightly averaged magnitudes of R = 11.23 ± 0.01. The CTA 102 continued brightening further with R = 10.98 ± 0.01 on 2016 December 28. The very next day, 2016 December 29, the source attained the optical magnitude of R = 10.92 ± 0.01, which represents the historically brightest level ever achieved by the source. During this period, the source was detected with a significant intra-night variability (INV), by Bachev et al. (2017), recently. While 0.4–0.5 mag changes were noticed within a few hours, fastest variability in optical was recoded with 0.2 mag change in just 30 min.
The source, therefore, shows strong day-to-day variations, in addition to intra-day, as revealed by our observations and those by others. Blazars are understood to be heavily jet dominated sources, hence events on the accretion disk should not affect the changes in the flux, particularly when the source is very active. In that case the physical processes responsible for rapid variations of the continuum flux in the inner jets should be instabilities in the particle acceleration mechanism, variations in the electron injection, small-scale inhomogeneities in the magnetic fields or the jet plasma.
Bachev et al. (2017) carried out multiband optical study of 2012 and 2016 flares in CTA 102. The authors found no variability in Mg II lines over few years duration. Any correlation between the nuclear flux variations and line emission would indicate nuclear emission being reprocessed by BLR. A time delay between the variations in the nuclear flux and flux in the Mg II line would enable estimation of the mass of the central black hole. On the other hand, characteristic variability timescale puts constraint on the size of the emission region. During our monitoring of the source in 2016 December, we found the brightest state (R = 10.92 mag) of the blazar CTA 102, with a characteristic variability timescale of about 35 min. Using this variability timescale in optical, we can estimate the size of emission region from,
 (1)
where c, δ = 35 (Casadio et al. 2015), and z(1.037) are the speed of light, Doppler factor and redshift, respectively. The size of the optical emission region, with variability timescale as 35 min, is estimated to be 1.08 × 1015 cm. Since the mass of the black hole for CTA 102 is 8.5 × 10⁸ M⊙ (Zamaninasab et al. 2014), the radius of event Horizon will be about 7.65 × 1014 cm which is of the order of the upper limit on the radius of emission region. It is, therefore, more likely that these rapid variations are originated far from SMBH at parsec or larger distances cause by small scale inhomogeneities or interaction of shocks moving down the jet with particle over-densities. Several blazars, including CTA 102 (Larionov et al. 2016), are known to show strong correlated flares in optical and γ-rays, generally linked to passing of relativistic blob through the radio core (Marscher et al. 2010; Agudo et al. 2011).
(1)
where c, δ = 35 (Casadio et al. 2015), and z(1.037) are the speed of light, Doppler factor and redshift, respectively. The size of the optical emission region, with variability timescale as 35 min, is estimated to be 1.08 × 1015 cm. Since the mass of the black hole for CTA 102 is 8.5 × 10⁸ M⊙ (Zamaninasab et al. 2014), the radius of event Horizon will be about 7.65 × 1014 cm which is of the order of the upper limit on the radius of emission region. It is, therefore, more likely that these rapid variations are originated far from SMBH at parsec or larger distances cause by small scale inhomogeneities or interaction of shocks moving down the jet with particle over-densities. Several blazars, including CTA 102 (Larionov et al. 2016), are known to show strong correlated flares in optical and γ-rays, generally linked to passing of relativistic blob through the radio core (Marscher et al. 2010; Agudo et al. 2011).
Nightly averaged R-band optical brightness magnitudes for the blazar CTA 102, obtained using 1.2 m MIRO telescope, during December 2016.
3.2.2 Sub-day activity in γ-ray regime
The γ-ray flux from CTA 102 also exhibited significant intra-day and day-to-day variations. The most pronounced 5d γ-ray flare, with unprecedented flux levels in the history of CTA 102, occurred around MJD 57751 (2016 December 29). The γ-ray flux, Fγ = 1.02 × 10⁻⁵ ph cm−2 s−1, larger by about 40% than the one recorded during 2012 flare as reported by Larionov et al. (2016), increased by >2.5 times in two days. This flare, along with its shoulder flare almost overlapped with it, cooled down during the following five days. The counterparts of this flare in the optical, UV and X-ray light curves show a lag by one day (cf. Fig. 1). The X-ray flux doubled in one day causing a sharp flare over already enhanced X-ray flux while optical and UV brightness increased by more than 1.5 and 2 mags, respectively, making these flares unprecedented across EMS.
An almost symmetric major γ-ray flare of 8d duration took place, centered around MJD 57760 (2017 January 7), with a peak flux of 8.98 ± 0.37 × 10⁻⁶ ph cm−2 s−1 (higher than 2012 levels) and Γ = −1.57 ± 0.02 following, with 1 day lag, the optical and UV flares with 1 mag and 2.8 mag enhancements, respectively. The X-ray was still showing a plateau while UV decayed slowly; the optical flux remained high for another three to four days followed by a rapid, albeit smooth, flux decrease. Little activity was seen in polarized flux, but the position angle changed by more than 150°. After this high activity, γ-ray flux dropped with a minor flare (on MJD 57769; 2017 January 16) towards the end, with a slightly enhanced X-ray flux.
The extreme flux levels reached during these outbursts prompted us to use smaller time bins of six and three hours (TS > 10) in the data in order to investigate rapid variability at shorter timescales during the two major γ-ray flares, centered at MJD 57751 (2016 December 29) and MJD 57760 (2017 January 7). Figure 4 shows the γ-ray lcs for the major flares during 2016 December (left) and 2017 January (right), with the upper panel showing six-hour and the lower panel showing three-hour binned data. Clearly, the source showed significant flux variability at sub-day timescale. The variability amplitudes were estimated using the relation,
 (2)
(2)
where, Amax and Amin are the maximum and minimum γ-ray fluxes respectively, and σ is the standard deviation.
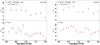 |
Fig. 4 γ-ray intra-day flux variability in CTA 102 using 3 h and 6 h binned data, for the two major flares on MJD 57750–57752 (left panel: December 2016) and MJD 57759-57761 (right panel: January 2017). |
The amplitude of variability, Avar, is estimated to be 6.70 (1.93) × 10−6 ph cm−2 s−1 on MJD 57751 and 6.25 (1.82) × 10−6 ph cm−2 s−1 on MJD 57760, with 3σ confidence. The shortest timescales can be used to put upper limit on the size of the γ-ray emitting region. To estimate the size of the γ-ray emission region, we used the doubling (or halving) timescales as calculated from,
 (3)
where F(t) and F(t0) represent the fluxes at time t and t0 and |τ| is halving timescale. The three-hour binned light curves during 2016 December 29 flare shows rapid variation and is used to get halving timescale. Using the above expression, we have estimated the shortest timescale of variability as τ = 4.72 h.
(3)
where F(t) and F(t0) represent the fluxes at time t and t0 and |τ| is halving timescale. The three-hour binned light curves during 2016 December 29 flare shows rapid variation and is used to get halving timescale. Using the above expression, we have estimated the shortest timescale of variability as τ = 4.72 h.
The shortest timescale of variability provides important information about the size of the emitting region. The timescale, calculated above, is used to constrain the γ-ray emission region size, estimated using the same expression (Eq. 1) as used for optical emission size above. The emission size is estimated to be 8.758 × 1015 cm. Recently, Shukla et al. (2018) used three-minute data bins from the 2018 April observations of CTA 102 and obtained a timescale of about five minunes, which is much shorter than the SMBH horizon light crossing time. The γ-ray emitting region, therefore, should be located down the jet far away from central engine (Tavecchio et al. 2010).
One of the major issues facing the blazar jet study is poorly understood structure of the jet – the manner in which matter responsible for energy dissipation is distributed along the jet. The determination of the location of high energy emitting region is possible, when the source is highly variable at those energies (preferably, in flaring state). The flaring or outbursts in blazars are rare phenomenon as most of the time they remain in quiescent or low flux state. Therefore, there are far fewer sources for which the location of the high energy emission is determined (Kaur et al. 2017a; Wu et al. 2018, and references there-in). The rapid variability in γ-rays, with a timescale of a few minutes to a few tens of minutes, suggests the emission region to lie close to the central engine, within a parsec (Tavecchio et al. 2010). The problem, however, is that γ-ray emission thus produced will get absorbed by the optical/UV photons of BLR region (Liu & Bai 2006; Poutanen & Stern 2010), jet or accretion outflow (Dermer & Schlickeiser 1993; Marscher et al. 1992). As a solution to this, Marscher et al. (2010), Tavecchio et al. (2010) proposed that the rapid variability could also be produced in the jet, far away from the black hole, if the emission region occupies only a small fraction of the jet instead of the whole cross section (jet-in-jet scenario). The strong correlations detected between γ-ray and mm-wave emissions are suggestive of the emitting regions at more than parsec away from the base of the jet, well beyond BLR. It has been seen in several sources that the γ-ray outbursts are triggered by the passage of superluminal blobs (knots) through the mm-submm VLBI core. Casadio et al. (2015) reported such trend in the data from 2007 to 2014 in CTA 102 with a suggestion that correlated flare occurred at about 12 pc away from SMBH, but only when motion of emitting regions coincided with the LOS. The issue, however, is still debatable.
Recently, Yan et al. (2018) estimated distances from the black holes to the dissipation regions from where γ-ray emission originated for the two blazars (PKS 1510-089 and BL Lac), based on the variability timescales. Here, we used the doubling timescale as shortest characteristic timescale of variability obtained for the γ-ray emission. To have an estimate of the distance to the γ-ray emitting region from the central super-massive black-hole, we need the information about the opening angle close to the base of the jet, Doppler factor (δ), flux doubling timescale (τd) and the redshift (z). The jet opening angle for blazars is generally less than one degree, as suggested by Jorstad et al. (2005), in general (Pushkarev et al. 2012) also put 1°.0 as the upper limit of opening angle for BL Lacs. We, therefore, estimated the distance to the location of γ-ray emission from central engine, using following relation,
 (4)
where, the jet opening angle is, θj ≈ 0°.7 (Jorstad et al. 2005). We find that the γ-ray emitting region is located at a distance of d = 5.58 × 1016 cm from SMBH, which is near the boundary of BLR (R = 6.7 × 1017 cm) dissipation region (Shukla et al. 2018) Fromm et al. (2015) estimated distance of the black hole from 86 GHz core in CTA 102 as about 7 pc using an opening angle of 2°.6 and a value of 35 for the Doppler factor, while γ-ray emission was produced at a distance of 12 pc away from black hole (Casadio et al. 2015). This appears to be more plausible region considering one can avoid pair production on BLR photons.
(4)
where, the jet opening angle is, θj ≈ 0°.7 (Jorstad et al. 2005). We find that the γ-ray emitting region is located at a distance of d = 5.58 × 1016 cm from SMBH, which is near the boundary of BLR (R = 6.7 × 1017 cm) dissipation region (Shukla et al. 2018) Fromm et al. (2015) estimated distance of the black hole from 86 GHz core in CTA 102 as about 7 pc using an opening angle of 2°.6 and a value of 35 for the Doppler factor, while γ-ray emission was produced at a distance of 12 pc away from black hole (Casadio et al. 2015). This appears to be more plausible region considering one can avoid pair production on BLR photons.
3.3. Fractional variability amplitude
In blazars, the variability is largely stochastic event in nature at all frequencies and timescales, particularly at shorter ones as these are governed by the relativistic jet processes. The similarities and differences among flare profiles reflect varying extents of the particle acceleration and energy dissipation. The amplitudes of variation would depend upon the strength of magnetic field, viewing angle, particle density and the efficiency of acceleration. The availability of good quality data across the EMS makes it possible to determine the variability amplitude at all the energies. This could be determined using the fractional root mean square (rms) variability parameter, introduced by Edelson & Malkan (1987), Edelson et al. (1990). Basically, the excess variance was used to compare the variability amplitudes at different energy bands from the same observation (Vaughan et al. 2003). This methodology has some limitations as it only works nicely for the densely sampled data that have small flux uncertainties at different energies, obtained from different instruments with different but high sensitivities. The large data gaps or high uncertainties in the flux measurements are capable of introducing larger values of rms variability amplitudes rendering the method useless. In the present case, the availability of good quality data across EMS allowed us to determine the variability in the source. The fractional variability and the associated errors are calculated using the relation by Vaughan et al. (2003),
 (5)
(5)
 (6)
where, S2 is the sample variance, σ2 is the mean square value of uncertainties associated with each observation, and R is the sample mean.
(6)
where, S2 is the sample variance, σ2 is the mean square value of uncertainties associated with each observation, and R is the sample mean.
The calculated values of the fractional variabilities thus obtained are given in Table 2. We find that the source exhibits larger fractional variability (Fvar) toward higher energies i.e. 0.87 in γ-rays, 0.45 in X-rays, 0.082 in UVW2-band, 0.059 in optical B-band. It shows that during the outburst period, jet emission was highly dominant. The large fractional variability toward higher frequencies could be due to large number of particles producing high energy emission. The internal shock model also predicts the high intrinsic amplitude of variability toward higher frequencies. Particularly low value of the fractional variability in optical could have been affected by the thermal contamination, though in the high flux state, its effect becomes negligible as noted by Larionov et al. (2016). On the other hand, Bonning et al. (2009) reported Fvar decreasing toward higher energies for FSRQ 3C454.3. This was due to significant steady thermal emission (BBB) from accretion disk and line emission in relatively low phase.
Fractional variability amplitudes (Fvar) for the blazar CTA 102 in different energy regimes.
3.4. Color and spectral behavior
It is interesting and informative to investigate how the color changes with flux variations in blazars. In general BL Lacs show bluer when brighter (BWB) color in optical supporting shock-in-jet model for the flux variations. On the other hand, FSRQs show RWB trend (Bonning et al. 2009). For the activity in CTA 102 during 2004–2005, Osterman Meyer et al. (2009) find RWB with rapid variations in brightness – 0.06 mag change within 15 min. They also note BWB behavior when source was in faint state due to excess in UV, big blue bump (BBB). It should be understood that BBB and highly beamed synchrotron emission from the jet contribute quite differently during the outburst and quiet phases of the source. In addition, for FSRQs, thermal contribution from the line emission, MgII λ 2800 Å in this case, will also contribute, depending upon the location of emission region and strength of the variable continuum. Larionov et al. (2016) find no change in the strength (effective width) of the Mg II line during the outburst. Thus enhanced activity in the jet had negligible effect on BLR. It could be due to flare happening far from BLR or it was partly due to change in geometry.
In the present study, we plotted (B–V) vs. B, (U–V) v/s U, (W2-W1) vs. W2 and (M2-W1) vs. M2. We have also plotted X-ray and γ-ray photon index (see, Fig. 1) along with light curves. We studied the spectral behavior of the source CTA 102 with respect to the source brightness and with time, during 2016 November-December–2017 January in the optical and UV energy regimes. In the color plot between B–V vs. B-mag, we noticed the sudden large changes in the B–V color during the flaring state, with 0.5–0.9 mag color change when source brightness changed from 12.38 to 12.45 mag. The source showed a mild BWB in the range 12.45–13.7 mag and RWB toward fainter than 14 mag. The overall trend revealed a mixed behavior of the source in different brightness states. We did not notice any significant change in the color with time. The similar spectral behavior is seen for U–V vs. V-mag. In the UV-regime (W2-W1 vs. W2-mag), we noticed a significant BWB trend during the bright state of the source while a mild RWB trend, when W2 > 12.5 mag, is seen. The (W2-W1) color shows drastic BWB behavior during flaring. However, no trend is noticed on the average. This could be due to the enhanced high energy particle density due to the passage of shock down the jet. In the present study, we noticed that the source is getting bluer during the flaring epochs but shows mixed behavior otherwise. In general we see a BWB trend when source is in flaring phase while a RWB color when it is relatively faint, while in-between, it either shows RWB or no trend at all. Osterman Meyer et al. (2009) report an RWB trend when CTA 102 was in high state while Bachev et al. (2017) and Zacharias et al. (2017) notice constant colors with time during intra-night variations. Gu et al. (2006) suggest an RWB behavior to be due to the presence of BBB in FSRQs, which could be significant in faint optical state and gets washed out when Doppler boosted jet emission dominates. Taking into account the spectral properties of flaring blazars, in general, the spectral trend from RWB to BWB is a kind of transition from FSRQ to BL Lac, where the synchrotron emission from the jet is dominant.
In the case of γ-rays, we notice a harder when brighter spectral trend, similar to what Shukla et al. (2018) have noticed. However, during the decay part of flare peaking at MJD = 57745, photon spectral index gets softer (increases) which continues up to the onset of next major flare. The X-ray photon spectral index (average range 0.8–1.8) anti-correlates with X-ray flux – spectra become harder when source is brighter, albeit photon index shows rather harder state while flux is almost constant during MJD 57758–57763.
Using the luminosity distance (dL) and the brightest X-ray flux value (FX), we estimated the X-ray jet isotropic luminosity to be  erg s-1. This exceeded the Eddington luminosity (LEdd = 1.11 × 1047 erg s−1; Fromm et al. 2015), with η = LX, jet/Ldisk = 6.4 in the source during its brightest phase, requiring a larger Lorentz factor.
3.5. Correlated variations using zDCF
We have also studied the correlated flux variations between two LCs obtained for different energy regimes. These provide the information on how well the variability in two energy bands matches and allows one to measure the time it takes for one emission region to respond to the changes in the other. From Fig. 1 it can be noticed that, broadly, all the fluxes in different energy regimes vary in-tandem. The 15 GHz radio flux has been on the decrease since its outburst phase during 2012 activity, apart from occasional enhancements. During MJD 57715 flare, optical/UV/X-ray lead γ- ray and radio, γ-ray, optical/UV peak at MJD 57740 when radio flux is increasing. The flux variations at 37 GHz and 230 GHz follow those in the R-band (Raiteri et al. 2017). To investigate it further quantitatively, we used the discrete correlation function (Edelson & Krolik 1988) to analyze correlated variations among light curves. The whole period of our consideration, which largely covers the outburst period 2016–2017, is dominated by a number of significant flares. These flares are possibly produced by the shocks moving down the inhomogeneous jet or by the change in the viewing angle, caused by helical jet motion, leading to variation in the Doppler factor.
Figure 5 shows the correlation plots for γ-ray & optical V-band (left panel), γ-ray & UV (center panel) and γ-ray & X-ray (right panel) light curves. As can be noticed from these zDCF plots, strong correlations are seen in all the cases with small or no lags (within errors or bin sizes).
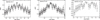 |
Fig. 5 Discrete correlations (zDCF) for CTA 102 between γ-rays and optical, UV and X-ray fluxes, respectively, during 2016 November–2017 January. |
The correlation plot for γ-ray and optical flux shows a very strong correlation without any significant lag (γ-ray lags by about 1 day, which is within the errors) between the variable emissions, with DCF peak value as 0.75. Similar behavior is shown by γ-ray vs. UV (Fig. 5, center panel). The correlation exhibited between γ-ray and optical emissions during this outburst is similar to the one reported for CTA 102 by Larionov et al. (2016) during the 2012 outburst where they found a remarkable similarity in their behavior. It was proposed that the two emission regions were co-spatial. They, however, reported 1 h as the time lag between γ-ray and optical emissions in the post-outburst phase and claimed the high energy emission to be produced under SSC process where seed photons are provided by the synchrotron low energy emission. Albeit, during the outburst, a linear relationship between the flux variations in the two energy bands was noticed indicating external seed photons getting up-scattered to higher energies during the flaring. The variable flux was explained based on the varying viewing angle, which results in change in Doppler boosting of the flux (Larionov et al. 2016). They also notice a harder when brighter trend in both the optical and γ-ray non-thermal emissions during this phase.
We note that if the γ-ray emission is due to inverse-Compton scattering of soft photons off the same electrons which produce the optical radiation, then its variations are likely to be simultaneous or delayed with respect to those in the optical radiation, due to light travel time delay, based upon non-thermal flares caused by the shocks moving down the jet (Sokolov et al. 2004). Such behavior was also noticed in FSRQ 4C38.41 (Raiteri et al. 2012) and 3C 454.3 (Bonning et al. 2009; Vercellone et al. 2009). However, the opposite behavior, γ- ray flux variations leading the optical ones, is also reported, for example, in the FSRQs PKS 1510-09 by Abdo et al. (2010) and for 3C 279 it was noticed by Hayashida et al. (2012). It could be explained based on the idea of faster decrease in the external seed photon energy density involved in inverse Compton process as compared to the decay in the magnetic field energy density, which plays dominant role in synchrotron emission, along the jet. Marscher (2014) discussed such a scenario when correlated emissions behave in such complex fashion based on the turbulence effects in the jet model (TEMZ). The changing magnitude and direction of a turbulent magnetic field largely leads to the variation in the synchrotron emission and hence a variable optical flux. It will not affect the high energy γ-ray flux. As an alternative explanation, high energy γ-ray emitting region could be better aligned with respect to the line of sight, as compared to optical emitting region, leading to higher Doppler boosting of high energy flux.
Such strong correlation between γ-ray and IR/optical/UV variations has been noticed for many other sources as well (Cohen et al. 2014; Bonning et al. 2009; Raiteri et al. 2011; Vercellone et al. 2009; Jorstad et al. 2013) and their co-spatial origin was inferred. It has also been seen in many cases that nature of the correlated variations between two emitted fluxes changes with epochs. Different values of the correlation parameters could be due to differential alignment of the one emitting region with respect to the other at different epochs (Villata et al. 2007, 2009; Raiteri et al. 2011). It could, perhaps be due to different processes and/or different particle populations being involved in the activity. In the case of FSRQ 3C454.3, Bonning et al. (2009) found strong correlation between γ-ray and IR/optical emission, with very short lag and a larger fractional variability toward larger wavelengths. They concluded that emissions are co-spatial and while low energy IR/optical emissions were due to synchrotron radiation, higher energy emissions were due to change in the injection of higher energy electron population instead of ambient thermal photons (which would lead to larger Fvar at higher energies).
The zDCF between γ-ray and X-ray flux (Fig. 5, right panel) shows significant correlation, with DCF value as 0.85 where the former leads the later by about one day. However, considering the bin size and data gaps resulting in larger errors, it is safer to say that these are correlated, with time lags within error. The two emissions, therefore originate from the same or close-by regions. Apart from this, the X-ray emission shows rather strange behavior if one looks at the flare-to-flare behavior of X-ray light curve. The rapidly rising γ-ray flare centered around MJD 57745 (2016 December 23) has counter-parts in optical and UV but X-ray flux shows decreasing trend. The slow decay of the flare was also traced well in these two bands, while the X-ray started rising and peaked, the γ-ray flux reached minimum. Even after the major γ-ray flare at MJD 57751 (2016 December 29), while all the fluxes decayed slowly, X-ray flux started increasing again, peaking when all the fluxes had reached their minima. The last major flare in γ-ray on MJD 57760 (2017 January 7) peaked with one day lag with respect to optical/UV bands while X-ray flux formed a plateau. Such an intriguing behavior of the X-ray flux during the high flux state seen in this source, has been noticed earlier for several other blazars (Carnerero et al. 2017; Kaur et al. 2017a; Cavaliere et al. 2017).
We note that during 2004–2005 high activity, X-ray, optical and radio emission were not correlated (Osterman Meyer et al. 2009). With no significant lags in our case, all the emission regions, therefore, appear to be at least co-spatial and can be explained by the inhomogeneous jet model in which a shock propagates down the jet, interacting with the plasma over densities or stationary cores distributed randomly in the jet, leading to the emission at progressively longer wavelengths (Blandford & Königl 1979; Marscher & Gear 1985). Such strong correlation between high energy emission and those at lower ones suggests that low energy emission is dominated by synchrotron emission, with minor contribution from accretion disk or host galaxy, while the higher energy emissions are due to up-scattering of the synchrotron photons with a possible contribution from external population of the seed photons, by the high energy electrons responsible for synchrotron emission (Jorstad et al. 2013).
3.6. Average flux levels in CTA 102 during 2016 outburst
The optical outburst activity during the period 2016 November to 2017 January, in CTA 102 is recently reported by Bachev et al. (2017) showing the brightest magnitude as R = 11.43 mag as on December 23, 2016. The authors reported the averaged R-band magnitude during the flaring period as 12.56 mag. We note that unprecedented flare fluxes apart, the average flux levels detected in the present study on CTA 102 are also the highest ever reported. We report the average brightness levels for γ-ray, X-ray, UV and optical as 2.39 × 10⁻⁶ ph cm−2 s−1, 2.75 × 10⁻¹¹ erg cm−2 s−1, 12.45 mag (W1), 13.44 mag & 11.63 (R;MIRO), respectively. However, the brightest values achieved by the blazar CTA 102 during the 2016 outburst are unprecedented as noted here, 1.04 × 10⁻⁵ ph cm−2 s−1 (γ-ray), 5.1 × 10⁻¹¹ erg cm−2 s−1 (X-ray; XRT), 12.45 mag (W1; UVOT), 13.44 mag (B; UVOT), 10.92 (R; MIRO). The long-term consistent increase in the optical flux (from about 14.5 in 2016 June to 10.92 mag in R-band on 2016 December 29) could be due to a systematic increase in the magnetic field strength, particle density or a systematic decrease of the external radiation energy density that reduces the probability of energy losses. Alternatively, these could result from a decrease in the viewing angle, which leads to stronger Doppler boosting of the jet emission (Bachev et al. 2017; Larionov et al. 2016) at higher frequencies.
4. Conclusions
After the 2012 huge optical flare, FSRQ CTA 102 flared up again, beginning 2016 June 8. This outburst with several flares covering complete EMS, is discussed using the data from Fermi-LAT, Swift-XRT/UVOT and ground based observatories, Steward & MIRO and OVRO. The study reveals that the source was in its historically brightest phases in the γ-ray, X-ray, optical and UV bands. There were several instances when the flux increased manifolds due to strong flaring events which lead to short-term (three to ten days) and long-term (30 days or longer) variability trends. The MIRO data suggest the source to show microvariability and strong day-to-day variations. We noticed correlated, quasi-simultaneous multiwavelength emissions with a delay within temporal bins, indicating their co-spatial origins. The larger values of fractional variability toward higher frequencies suggest more activity at higher energies. Based on the halving timescale (τ = 4.72 h) in γ-ray flux, the emission region size is estimated to be as 8.76 × 1015 cm. Taking the jet opening angle as 0°.7 (Jorstad et al. 2005), we estimated the distance of γ-ray emission region from the central super-massive black hole as 5.58 × 1016 cm which lies near the boundary of BLR region.
It is proposed that the consistent flaring activity, which kept the flux levels high, is caused by the frequent injection of plasma into the jet and its interaction with quasi-stationary core. The strong shocks lead to the subsequent gain in the particle energy, on either side of the shock, leading to the enhanced flux levels. As an alternative explanation, viewing angle could be decreasing which will lead to enhanced emission throughout EMS due to increase in Doppler boosting. The base flux could be enhanced by perturbation or as a series of discrete, possibly overlapping flares, originating at shock fronts as shocks travel down the jet.
We infer a harder when brighter spectral behavior in X- and γ-ray emissions. A relatively softer trend during major γ-ray flares, when near peak, suggests an efficient cooling mechanism due, perhaps, to the high particle density in the vicinity of BLR (Sikora et al. 2002) leading to the rapid quenching of particles before their attaining higher energies. On the other hand, higher energy radiation and/or particles might be escaping the emitting region. Rapid flares could be the result of interaction of blobs with the plasma inhomogeneities or irregularities in the emission region. In the multiwavelength lcs, X-ray emission behaves rather strangely at times, which could be due to its differential orientation with respect to LOS or different origin of the X-ray emission.
Acknowledgments
This work is supported by the Department of Space, Government of India. We are thankful to the Referee for fruitful suggestions. We also thank Drs. S. Ganesh, P. Grandi, E. Torresi, and M. Cappi for discussions. Data from the Steward Observatory spectro-polarimetric monitoring project, supported by Fermi Guest Investigator grants NNX08AW56G, NNX09AU10G, NNX12AO93G, and NNX15AU81G, are used. We used Enrico, a community-developed Python package to simplify Fermi-LAT analysis. This work made use of data supplied by the UK Swift Science Data Centre at the University of Leicester (Evans et al. 2007).
References
- Abdo, A. A., Ackermann, M., Agudo, I., et al. 2010, ApJ, 716, 30 [NASA ADS] [CrossRef] [Google Scholar]
- Agudo, I., Marscher, A. P., Jorstad, S. G., et al. 2011, ApJ, 735, L10 [NASA ADS] [CrossRef] [Google Scholar]
- Aharonian, F., Akhperjanian, A., Beilicke, M., et al. 2003, A&A, 406, L9 [NASA ADS] [CrossRef] [EDP Sciences] [Google Scholar]
- Alexander, T. 2014, ZDCF: Z-Transformed Discrete Correlation Function, Astrophysics Source Code Library [record ascl: ascl:1404.002] [Google Scholar]
- Atwood, W. B., Abdo, A. A., Ackermann, M., et al. 2009, ApJ, 697, 1071 [NASA ADS] [CrossRef] [Google Scholar]
- Bach, U., Raiteri, C. M., Villata, M., et al. 2007, A&A, 464, 175 [NASA ADS] [CrossRef] [EDP Sciences] [Google Scholar]
- Bachev, R., Popov, V., Strigachev, A., et al. 2017, MNRAS, 471, 2216 [NASA ADS] [CrossRef] [Google Scholar]
- Blandford, R. D., & Königl, A. 1979, ApJ, 232, 34 [NASA ADS] [CrossRef] [Google Scholar]
- Bonning, E. W., Bailyn, C., Urry, C. M., et al. 2009, ApJ, 697, L81 [NASA ADS] [CrossRef] [Google Scholar]
- Böttcher, M. 2006, ApJ, 641, 1233 [NASA ADS] [CrossRef] [Google Scholar]
- Bulgarelli, A., Verrecchia, F., Lucarelli, F., et al. 2016, ATel, 9788 [Google Scholar]
- Carnerero, M. I., Raiteri, C. M., Villata, M., et al. 2017, MNRAS, 472, 3789 [NASA ADS] [CrossRef] [Google Scholar]
- Carrasco, L., Miramon, J., Recillas, E., et al. 2016, ATel, 9801 [Google Scholar]
- Casadio, C., Gómez, J. L., Jorstad, S. G., et al. 2015, ApJ, 813, 51 [NASA ADS] [CrossRef] [Google Scholar]
- Cavaliere, A., Tavani, M., & Vittorini, V. 2017, ApJ, 836, 220 [NASA ADS] [CrossRef] [Google Scholar]
- Chandra, S., Zhang, H., Kushwaha, P., et al. 2015, ApJ, 809, 130 [NASA ADS] [CrossRef] [Google Scholar]
- Ciprini, S., & Verrecchia, F. 2016, ATel, 9841 [Google Scholar]
- Clements, S. D., Smith, A. G., Aller, H. D., & Aller, M. F. 1995, AJ, 110, 529 [NASA ADS] [CrossRef] [Google Scholar]
- Cohen, D. P., Romani, R. W., Filippenko, A. V., et al. 2014, ApJ, 797, 137 [NASA ADS] [CrossRef] [Google Scholar]
- Dermer, C. D., & Schlickeiser, R. 1993, ApJ, 416, 458 [NASA ADS] [CrossRef] [Google Scholar]
- Dickey, J. M., & Lockman, F. J. 1990, ARA&A, 28, 215 [NASA ADS] [CrossRef] [MathSciNet] [Google Scholar]
- Edelson, R. A., & Malkan, M. A. 1987, ApJ, 323, 516 [NASA ADS] [CrossRef] [Google Scholar]
- Edelson, R. A., & Krolik, J. H. 1988, ApJ, 333, 646 [NASA ADS] [CrossRef] [Google Scholar]
- Edelson, R. A., Krolik, J. H., & Pike, G. F. 1990, ApJ, 359, 86 [NASA ADS] [CrossRef] [Google Scholar]
- Evans, P. A., Beardmore, A. P., Page, K. L., et al. 2007, A&A, 469, 379 [NASA ADS] [CrossRef] [EDP Sciences] [Google Scholar]
- Fromm, C. M., Perucho, M., Ros, E., Savolainen, T., & Zensus, J. A. 2015, A&A, 576, A43 [NASA ADS] [CrossRef] [EDP Sciences] [Google Scholar]
- Gu, M. F., Lee, C.-U., Pak, S., Yim, H. S., & Fletcher, A. B. 2006, A&A, 450, 39 [NASA ADS] [CrossRef] [EDP Sciences] [Google Scholar]
- Hayashida, M., Madejski, G. M., Nalewajko, K., et al. 2012, ApJ, 754, 114 [NASA ADS] [CrossRef] [Google Scholar]
- Jorstad, S. G., Marscher, A. P., Lister, M. L., et al. 2005, AJ, 130, 1418 [NASA ADS] [CrossRef] [Google Scholar]
- Jorstad, S. G., Marscher, A. P., Smith, P. S., et al. 2013, ApJ, 773, 147 [NASA ADS] [CrossRef] [Google Scholar]
- Kaur, N. 2017, PhD Thesis, Gandhinagar, India [Google Scholar]
- Kaur, N., Chandra, S., Baliyan, K. S., Sameer, & Ganesh, S. 2017a, ApJ, 846, 158 [NASA ADS] [CrossRef] [Google Scholar]
- Kaur, N., Sameer, Baliyan, K. S., & Ganesh, S. 2017b, MNRAS, 469, 2305 [NASA ADS] [Google Scholar]
- Larionov, V. M., & Kopatskaya, E. N. 2016, ATel, 9130 [Google Scholar]
- Larionov, V. M., Villata, M., Raiteri, C. M., et al. 2016, MNRAS, 461, 3047 [NASA ADS] [CrossRef] [Google Scholar]
- Liu, H. T., & Bai, J. M. 2006, ApJ, 653, 1089 [NASA ADS] [CrossRef] [Google Scholar]
- MacDonald, N. R., Jorstad, S. G., & Marscher, A. P. 2017, ApJ, 850, 87 [NASA ADS] [CrossRef] [Google Scholar]
- Marscher, A. P. 2014, ApJ, 780, 87 [NASA ADS] [CrossRef] [Google Scholar]
- Marscher, A. P., & Gear, W. K. 1985, ApJ, 298, 114 [NASA ADS] [CrossRef] [Google Scholar]
- Marscher, A. P., Gear, W. K., & Travis, J. P. 1992, in Variability of Blazars eds. Valtaoja E. & Valtonen M. (Cambridge: Cambridge Univ. Press), 85 [Google Scholar]
- Marscher, A. P., Jorstad, S. G., Larionov, V. M., et al. 2010, Multiple Gamma-ray Flares from Superluminal Knots in Blazars, BAAS, 42, 421 [Google Scholar]
- Nolan, P. L., Bertsch, D. L., Fichtel, C. E., et al. 1993, ApJ, 414, 82 [NASA ADS] [CrossRef] [Google Scholar]
- Nolan, P. L., Abdo, A. A., Ackermann, M., et al. 2012, ApJS, 199, 31 [NASA ADS] [CrossRef] [Google Scholar]
- Osterman Meyer, A., Miller, H. R., Marshall, K., et al. 2008, AJ, 136, 1398 [NASA ADS] [CrossRef] [Google Scholar]
- Osterman Meyer, A., Miller, H. R., Marshall, K., et al. 2009, AJ, 138, 1902 [NASA ADS] [CrossRef] [Google Scholar]
- Paturel, G., Dubois, P., Petit, C., & Woelfel, F. 2002, LEDA, 0 [Google Scholar]
- Poutanen, J., & Stern, B. 2010, ApJ, 717, L118 [Google Scholar]
- Pushkarev, A. B., Hovatta, T., Kovalev, Y. Y., et al. 2012, A&A, 545, A113 [NASA ADS] [CrossRef] [EDP Sciences] [Google Scholar]
- Raiteri, C. M., Ghisellini, G., Villata, M., et al. 1998, A&AS, 127, 445 [NASA ADS] [CrossRef] [EDP Sciences] [Google Scholar]
- Raiteri, C. M., Villata, M., Aller, M. F., et al. 2011, A&A, 534, A87 [NASA ADS] [CrossRef] [EDP Sciences] [Google Scholar]
- Raiteri, C. M., Villata, M., Smith, P. S., et al. 2012, A&A, 545, A48 [NASA ADS] [CrossRef] [EDP Sciences] [Google Scholar]
- Raiteri, C. M., Villata, M., Acosta-Pulido, J. A., et al. 2017, Nature, 552, 374 [NASA ADS] [CrossRef] [Google Scholar]
- Richards, J. L., Max-Moerbeck, W., Pavlidou, V., et al. 2011, Fermi Symp. Proc. - eConf C110509, ArXiv e-prints [arXiv: arXiv:1307.4534] [Google Scholar]
- Roming, P. W. A., Kennedy, T. E., Mason, K. O., et al. 2005, Space Sci. Rev., 120, 95 [NASA ADS] [CrossRef] [Google Scholar]
- Sanchez, D. A., & Deil, C. 2013, 3rd International Cosmic Ray Conf. (ICRC2013), ArXiv e-prints [arXiv:1307.4534] [Google Scholar]
- Shukla, A., Mannheim, K., Patel, S. R., et al. 2018, ApJ, 854, 26 [Google Scholar]
- Sikora, M., Blazejowski, M., Moderski, R., & Madejski, G. M. 2002, ApJ, 577, 78 [NASA ADS] [CrossRef] [Google Scholar]
- Smith, P. S., Montiel, E., Rightley, S., et al. 2009, Fermi Symp. Proc. - eConf C091122 [Google Scholar]
- Sokolov, A., Marscher, A. P., & McHardy, I. M. 2004, ApJ, 613, 725 [NASA ADS] [CrossRef] [Google Scholar]
- Tavecchio, F., Ghisellini, G., Bonnoli, G., & Ghirlanda, G. 2010, MNRAS, 405, L94 [NASA ADS] [CrossRef] [Google Scholar]
- Tornikoski, M., Terasranta, H., Balonek, T. J., & Beckerman, E. 1999, Simultaneous Radio/Optical Outburst in CTA 102, ASP Conf. Ser., 159, 307 [NASA ADS] [Google Scholar]
- Vaughan, S., Edelson, R., Warwick, R. S., & Uttley, P. 2003, MNRAS, 345, 1271 [NASA ADS] [CrossRef] [Google Scholar]
- Vercellone, S., Chen, A. W., Vittorini, V., et al. 2009, ApJ, 690, 1018 [NASA ADS] [CrossRef] [Google Scholar]
- Verrecchia, F., Munar-Adrover, P., Pittori, C., et al. 2016, ATel, 9840 [Google Scholar]
- Villata, M., Raiteri, C. M., Aller, M. F., et al. 2007, A&A, 464, L5 [NASA ADS] [CrossRef] [EDP Sciences] [Google Scholar]
- Villata, M., Raiteri, C. M., Larionov, V. M., et al. 2009, A&A, 501, 455 [NASA ADS] [CrossRef] [EDP Sciences] [Google Scholar]
- Williamson, K. E., Jorstad, S. G., Marscher, A. P., et al. 2014, ApJ, 789, 135 [NASA ADS] [CrossRef] [Google Scholar]
- Wu, L., Wu, Q., Yan, D., Chen, L., & Fan, X. 2018, ApJ, 852, 45 [NASA ADS] [CrossRef] [Google Scholar]
- Yan, D., Wu, Q., Fan, X., Zhang, L., & Wang, J. 2018, ApJ, 859, 168 [NASA ADS] [CrossRef] [Google Scholar]
- Zacharias, M., Böttcher, M., Jankowsky, F., et al. 2017, ApJ, 851, 72 [NASA ADS] [CrossRef] [Google Scholar]
- Zamaninasab, M., Clausen-Brown, E., Savolainen, T., & Tchekhovskoy, A. 2014, Nature, 510, 126 [NASA ADS] [CrossRef] [PubMed] [Google Scholar]
All Tables
Nightly averaged R-band optical brightness magnitudes for the blazar CTA 102, obtained using 1.2 m MIRO telescope, during December 2016.
Fractional variability amplitudes (Fvar) for the blazar CTA 102 in different energy regimes.
All Figures
|
Fig. 1 Multiwavelength light curves for CTA 102 during the 2016 November–2017 January outburst. From top panel to bottom panel: 1d binned Fermi-LAT γ-ray flux (E > 100 MeV) followed by γ-ray photon index; X-ray (2.0–10.0 keV) flux (Swift-XRT); X-ray photon index (γ; Swift-XRT); UV-band (W1, M2, W2) magnitudes (Swift-UVOT); Swift-UVOT, MIRO and Steward Observatory optical magnitudes; 15 GHz OVRO flux; Degree of Polarization (DP%) and position angle, PA, in degrees (Steward Observatory). |
| In the text | |
|
Fig. 2 γ-ray light curve of FSRQ CTA 102 showing flaring activity during November 2016–January 2017. Time in MJD is plotted along X-axis and flux along Y-axis. The gray dashed line shows the average flux level. |
| In the text | |
|
Fig. 3 Light curves for the intra-day brightness variability in CTA 102 in optical R-band on 2016 December 18, 19, 20 & 21. Significant (more than 3σ) IDV is noticed on December 18, 20 & 21. |
| In the text | |
|
Fig. 4 γ-ray intra-day flux variability in CTA 102 using 3 h and 6 h binned data, for the two major flares on MJD 57750–57752 (left panel: December 2016) and MJD 57759-57761 (right panel: January 2017). |
| In the text | |
|
Fig. 5 Discrete correlations (zDCF) for CTA 102 between γ-rays and optical, UV and X-ray fluxes, respectively, during 2016 November–2017 January. |
| In the text | |
Current usage metrics show cumulative count of Article Views (full-text article views including HTML views, PDF and ePub downloads, according to the available data) and Abstracts Views on Vision4Press platform.
Data correspond to usage on the plateform after 2015. The current usage metrics is available 48-96 hours after online publication and is updated daily on week days.
Initial download of the metrics may take a while.