| Issue |
A&A
Volume 617, September 2018
|
|
|---|---|---|
| Article Number | A85 | |
| Number of page(s) | 10 | |
| Section | Interstellar and circumstellar matter | |
| DOI | https://doi.org/10.1051/0004-6361/201731707 | |
| Published online | 20 September 2018 | |
Modeling dust emission in PN IC 418★
1
Instituto de Astronomía, Universidad Nacional Autónoma de Mexico,
Apdo. postal 70–264; Ciudad Universitaria; Mexico
CDMX 04510,
Mexico
e-mail: This email address is being protected from spambots. You need JavaScript enabled to view it.
, This email address is being protected from spambots. You need JavaScript enabled to view it.
2
Nicolaus Copernicus Astronomical Center, PAS,
ul. Rabiańska 8,
87-100
Toruń,
Poland
3
Instituto de Astrofísica de Canarias,
Vía Láctea s/n,
38205
La Laguna,
Tenerife,
Spain
4
Departamento de Astrofísica, Universidad de La Laguna (ULL),
38206
La Laguna,
Tenerife,
Spain
5
Herschel Science Centre, ESAC/ESA,
PO Box 78,
28691
Villanueva de la Cañada,
Madrid,
Spain
Received:
3
August
2017
Accepted:
30
May
2018
Abstract
We investigated the infrared (IR) dust emission from PN IC 418, using a detailed model controlled by a previous determination of the stellar properties and the characteristics of the photoionized nebula, keeping as free parameters the dust types, amounts, and distributions relative to the distance of the central star. The model includes the ionized region and the neutral region beyond the recombination front (photodissociation region, or PDR), where the [O I] and [C II] IR lines are formed. We succeeded in reproducing the observed infrared emission from 2 to 200 μm. The global energy budget is fitted by summing up contributions from big grains of amorphous carbon located in the neutral region and small graphite grains located in the ionized region (closer to the central star). Two emission features seen at 11.5 and 30 μm are also reproduced by assuming them to be due to silicon carbide (SiC) and magnesium and iron sulfides (MgxFe1−xS), respectively. For this, we needed to consider ellipsoidal shapes for the grains to reproduce the wavelength distribution of the features. Some elements are depleted in the gaseous phase: Mg, Si, and S have sub-solar abundances (−0.5 dex below solar by mass), while the abundance of C + N + O + Ne by mass is close to solar. Adding the abundances of the elements present in the dusty and gaseous forms leads to values closer to but not higher than solar, confirming that the identification of the feature carriers is plausible. Iron is strongly depleted (3 dex below solar) and the small amount present in dust in our model is far from being enough to recover the solar value. A remaining feature is found as a residue of the fitting process, between 12 and 25 μm, for which we do not have identification.
Key words: planetary nebulae: general / planetary nebulae: individual: IC 418 / infrared: ISM / dust, extinction
Based on observations with ISO, an ESA project with instruments funded by ESA Member States (especially the PI countries: France, Germany, The Netherlands, and the UK) and with the participation of ISAS and NASA.
© ESO 2018
1 Introduction
Planetary nebulae (PNe), as the ultimate stage of intermediate mass stars, are an essential provider in the chemical enrichment of the Universe. They also generate, while in the asymptotic giant branch (AGB) phase previously to the PN, most of the dust present in the local Universe (e.g., Ferrarotti & Gail 2006). This dust occults some elements from the observer, diminishing their emission in the gas phase. When studying the chemical evolution by obtaining the total abundances in the interstellar medium (ISM), it is necessary to account for both gas and dust abundances. We note that obtaining the dust abundances is not an easy task.
The relatively simple morphology and the great number of observations on the PN IC 418, especially in the infrared (IR), makes it a good object to study the dust emission. In our paper we concentrate on the dust component of PN IC 418, which together with the very detailed analysis of atomic gas and stellar component in this nebula by Morisset & Georgiev (2009; hereafter MG09) provide a quite complete model of this object. However, we do not model the molecular component, which to our best knowledge, is not observed in IC 418.
An analysis of near infrared (NIR) maps of IC 418 has been made by Phillips et al. (1986), finding that this nebula will need at least two types of grains, one that will emit at longer wavelengths (with a larger grain radius) and another with a small radius, that causes the excess at the NIR. Two very interesting features are found in the infrared emission of IC 418. The first, found by Willner et al. (1979), is an emission excess from 10.5 to 13 μm, which they suggest is due to silicon carbide (SiC) grains, following Treffers & Cohen (1974). The second is an emission feature at λ ~ 30 μm, first partially (in the 16–30 μm range) found by Forrest et al. (1981) in a spectroscopic study of carbon stars and PNe. It is fully reported by Moseley & Silverberg (1985, 1986) and usually associated with magnesium sulfide (MgS) grains, following Goebel & Moseley (1985).
Modeling dust emission, in particular from IC 418, has been done by Hoare (1990). A very detailed photoionization and stellar atmosphere model has been presented by MG09 that reproduces the main characteristics of the nebular and stellar emissions. More recently, Dopita et al. (2017) present a revised model of the nebula, taking into account the presence of shocks at the inner and outer edges of the ionized region. In this paper we have carried out a new study of the IR dust emission for this object, mainly based on ISO observations and using as a starting point the MG09 model.
Obtaining a model that fits the dust emission, in the global as well as in the detail, allow us to compute the amount of elements embedded in dust and compare them to the amount present in the gaseous phase. Given that IC 418 is marginally over-solar for C + N + O + Ne (0.1 dex above the solar value, by mass, see MG09), we expect to obtain total abundances (gaseous phase + dust) for Mg, Si, S, and Fe comparable to the solar values.
The structure of this paper is as follows. In Sect. 2 we describe the observations of PN IC 418 used to constrain the models. In Sect. 3 we present the model needed to reproduce the continuum IR dust emission. In Sect. 4 the detailed modeling of two special spectral features is shown. In Sect. 5 we present the best fit model. The discussion and conclusions are given in Sects. 6 and 7, respectively.
2 Observations
The source IC 418 is a very well observed young low-ionization PN of size 10′′ × 12′′. In this workwe use observations from the literature and from public access archive. The ISO observations were reduced using ISAP and LIA software with OLP version 10.1, where leakage from the 13 μm region is corrected (see Hony et al. 2002). The spectrum up to 27.5 μm was normalized to IRAS photometry at 12 and 25 μm, and band 4 was scaled to smoothly join LWS spectrum which was normalized to the 100 μm IRAS flux. Then band 3E between 27.5 and 29 μm was scaled to join these two parts of the spectrum. We notice that the ISO smallest aperture is 14′′ × 20′′, thus the whole PN is observed and no aperture effect is expected. Spitzer data are only covering the 9.9–19.6 μm range, and are in a relative good agreement with the ISO data (the Spitzer Infra-Red Spectrograph Short-High spectrum was taken through an aperture size of 4.7′′ × 11.3′′, then only part of the nebula is observed). In the following we only used the ISO data.
Forrest et al. (1981) give observed points from KAO, showing a double peak between 25 and 30 μm, which is also seen in the ISO data. However, Hony et al. (2002), argued that such appearance of the 30 μm feature is a result of the instrumental effect from the ISO spectrograph. It is not clear what is the reason for the double peak structure of the 30 μm feature from the KAO data. The fluxes reported are smaller than the ISO fluxes by a factor of ~1.6. Aperture size effects are not suspected to be the cause of this discrepancy, as the KAO beam is 30′′ wide. The ISO spectroscopic data are in a very good agreement with the IRAS data at 12, 25, 60, and 100 μm. We also used far-IR and radio observations at 450, 800, 801, and 1100 μm from Hoare et al. (1992) and radio observations between 2700 and 353 000 MHz from Dixon (1970); Wright et al. (1991); Vollmer et al. (2010); Murphy et al. (2010), and Planck Collaboration Int. XVIII (2015).
3 The infrared continuum modeling
Previous models of the IR emission of PN IC 418 have been made by Hoare (1990), before ISO data were available. They used a model combining the emissionof the H+ photoionized region and the emission from a neutral region.
In a previous work, MG09 compute a detailed 3D model of IC 418, combining a stellar model using CMFGEN (Hillier & Miller 1998) and a photoionization model using Cloudy_3D (Morisset 2006), based on Cloudy code (Ferland et al. 1998). The density distribution used in MG09 was not spherical, but rather axi -symmetrical, to reproduce the Hubble Space Telescope (HST) images and to carefully compute the line intensities as observed through different apertures depending on the instruments used. In the present work, we will not need this level of details because the observations we aim to fit have been obtained by ISO spectrometers, with aperture sizes comparable or greater than the size of IC 418. The departure from sphericity of IC 418 is small and using a spherical model will decrease the CPU time without affecting our conclusions. We checked a posteriori that increasing the position of the two density shells by 10% does not significantly change the result. A change of a maximum of 5% in the dust emission is obtained, no change in the shape. The abundances of the elements in the gas are set as in the MG09 model, except for Si (see next section). The models usedin this study are obtained with Cloudy v. 17.00 (Ferland et al. 2017) and the pyCloudy library (Morisset 2014).
The photoionization models presented in this work are all obtained using the stellar atmosphere model presented in MG09 (with Teff ~36.7 K) but with a smaller luminosity of 5900 solar luminosity, as less dust is present in the ionized region of the present detailed model than assumed by MG09. We kept the distance to its MG09 value of 1.26 kpc. These luminosity and distance lead to a very good agreement between the observed and predicted values for the radio emission reported by Hoare (1990). On the other side, the Hβ flux is not so well reproduced by the model. The observed value is 2.7 × 10⁻¹⁰ erg cm−2 s−1 (Cahn et al. 1992). Using a distance of 1.26 kpc, EB−V = 0.26, and RV = 3.6 (MG09; Fitzpatrick 1999), a total emitted flux of 1.37 × 1035 erg s−1 is obtained, while the model predicts a value of 1.03 × 1035 erg s−1. We did not find any way to reconcile Hβ and radio fluxes with the same model. In their recent model of IC 418, Dopita et al. (2017) are fitting Hβ, but they do not predict the IR nor the radio emission. We actually prefer to fit the radio observations, less influenced by uncertainties on the reddening correction.
3.1 Photoionization model extended into the PDR
The H density distribution used in the models presented here is a mean between the short- and long-axes distribution used in MG09, namely a double shell, as shown in Fig. 1. In the model presented by MG09, the computation is stopped when H recombines, just behind the secondary peak. But the observation of strong fine structure IR lines issuing from the neutral region (namely [O I] 63 146 μm and [C II] 158 μm) indicate that the nebula actually extends beyond the recombination front and that a PDR region is present. The PDR properties can be constraint using Fig. 6 of Liu et al. (2001), who determined a temperature of 220 K and a density of 3 × 10⁵ H cm−3 for IC 418 (we check with the final model that none of these lines is optically thick and that the relation is valid). This PDR also contains dust taking part to the observed IR emission, and we needed to extend the photoionization models to include this region. This is achieved by allowing Cloudy to continue the computation after the recombination front. The PDR density is ~20 times higher than the density of the ionized outer shell, while the electron temperature is ~35 times lower. This leads us to adopt a very simple density law for the PDR of the form: n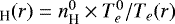 , for r > Rrecomb. We set
  and
and  to their values just before the recombination front, that is13 000 H cm−3 and 10 000 K, respectively.
The thickness of the PDR is determined by stopping the computation when the intensity of one of the IR lines reaches its observed value: we used [O I] 63μm absolute intensity of 5.2 × 10⁻¹¹ erg cm−2 s−1 (Liu et al. 2001; Pottasch et al. 2004) as stopping criterion. The model actually stopped at the closest value of 4.8 × 10⁻¹¹ erg cm−2 s−1. The value used to stop the computation (i.e., the size of the PDR) has a direct influence on the dust-to-gas ratio (D/G)we obtain by fitting the IR dust emission. The PDR has a relatively small thickness (~1.5 × 1015 cm, but see below), but contains a mass of gas of order of the ionized shell one (the H+ mass is 0.047 M⊙ while the H0 mass is 0.039 M⊙). We don’t think the PDR can be much bigger than this value, otherwise the intensities of these infrared lines would be quite higherthan the observation, especially considering that the lines are not optically thick. We note also that Dayal & Bieging (1996) did not find evidence of CO emission from IC 418, so that we ruled out the presence of a molecular halo, which could also have emitted some IR continuum. The geometrical thickness of the PDR is very small compared to the size of the nebula (on the order of 1%). We chose to add a filling factor to the PDR region so that this size increases. It does not change anything else regarding the line or dust emission, but it makes the plots easier to look at. We used a value for this PDR filling factor of 0.1.
We used the “iterate 3” option in the Cloudy model to ensure that the values for the IR lines are well computed. The final model presented below has a mean electron temperature of ~462 K and a mean hydrogen density of ~3.0 × 105 cm3 for the PDR, see Fig. 1 where we show the radial variations of the H and e densities, as well as the electron temperature. We clearly see the jump of all these quantities at the recombination front.
It turns out that [Si II] 34.8 μm, the only available line of silicon, is mainly emitted by the PDR. To fit the observed value (relative to [O I] 63.17 μm), an abundance of only −5.55 (in log) is needed, while MG09 obtained −4.90 when taking only the ionized region into account.
The electron (or even more relevant in the case of a PDR, proton) temperature can be obtained from diagnostic diagrams following Liu et al. (2001). We note that since their paper, new atomic data have been published (e.g., Abrahamsson et al. 2007) that would lead to an even lower temperature for the PN PDRs. The [C II]/[O I] line ratio diagnostic has to be normalized by the C/O. This latest value is known for the ionized part of the nebula, but the IR emission lines actually come from the H0 region where C can be more depleted, changing the diagnostics.
Our model fails somewhat in reproducing the following diagnostics: the modeled (observed) intensity ratios for [O I]145.5/63.17 μm and [C II]157.6 μm / [O I]63.17μm are 0.028 (0.028) and 0.085 (0.112), respectively. The PDR is then predicted systematically warmer than what determined from line ratios. But the dust temperature is totally decorrelated from the gas temperature. Not fitting the gaseous temperature does not jeopardize the dust emission model.
In a recent work, Dopita et al. (2017) present new observations and a new model of the IC 418 nebula, based on the photoionization+shock modeling tool Mappings V (Dopita et al. 2005; Sutherland & Dopita 2017). They found a global agreement with the model described by MG09. They added two shocked regions: one in the inner face of the H+ region, due to the stellar wind ram pressure, and a second one in the outer part of the same H+ region, where it collides with the preexisting AGB stellar wind. Contrary to the model presented in our work, their model is not able to take into account the PDR, which according to our model contains five times more dust than the ionized region (see Table 1). We were not able to include the shocked regions in our model, as Cloudy does not manage them. Nevertheless, we prefer including the PDR than the shocked region.
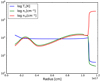 |
Fig. 1 Electron temperature, electron density, and hydrogen density. |
Properties of the H+ region and the PDR.
3.2 Usual dust emission is too hot: need for cooler grains
To reproduce the global shape of the IR continuum emission observed by ISO between 2 and 200 μm, we used amorphous carbon (AC) dust (the nebula is carbon-rich, see MG09). We find a slightly better fit using BE1 type of amorphous carbon (Rouleau & Martin 1991).
With dust of canonical sizes (from 0.005 to 0.25 μm, following a −3.5 slope power law, and using ten different sizes of grains logarithmically distributed on the size range) distributed in the whole nebula (ionized region and PDR), the resulting emission exhibits a too-hot continuum (the peak emission is close to 20 μm instead of the observed30 μm peak, see blue dashed line in Fig. 2). To reduce the dust temperature, one can put the dust in the outer part of the nebula, or increase its size (see Appendix A). We chose to first adjust the far-IR observations (50–200 μm) without over-predicting the observed emission at lower wavelengths: for this we used a size distribution of big grains between 0.03 and 0.4 μm following power law size distribution, only in the PDR region. In our best fit model, we find that a slope of −3.7 gives a better result than the classical one of −3.5.
The resulting dust emission (shown in green in Fig. 2) fits the long wavelengths observations, and is too low in the shorter wavelengths range. To solve this problem, we added other size and type dust grains, as described in the next sections.
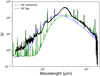 |
Fig. 2 Dust emission of amorphous carbon. The blue dashed line represents canonical size (0.005–0.25 μm) grains in the whole nebula, and the green solid line represents big (0.03–0.4 μm) grains only in the PDR. PN IC 418 observations are in black. |
3.3 Adding very small grains
To increase the emission in the near-IR (2–10 μm), we add a component of very small grains (sizes from 0.0005 to 0.03 μm, distributed into ten grain sizes following a −3.5 slope power law) of graphite type. We obtain a better fit using graphite than using amorphous carbon. We put these small grains in the ionized region only, to increase the quality of the fit and following results on radiative pressure on dust grains by Ishiki et al. (2018). Cloudy takes into account the quantum heating for these small grains. The emission obtained adding these grains is shown in red in Fig. 3, compared to the emission from only big grains in the PDR (in green). The observed spectrum in black is clearly better fitted in the very short wavelengths range when this component is taken into account. Nevertheless, emission is still missing in the middle wavelength range (10–50 μm), this will be fitted by SiC and MgS grains, as described in the next section. The presence of such small grains close to the star seems to contradict the grain destruction by sputtering described by, for example, Barlow (1978) or Draine & Salpeter (1979) or more recently by Weingartner et al. (2006). On the other hand, depletion of refractory elements, especially Fe, Si, and Ca (see, e.g., Shields 1983; Volk et al. 1997), indicates that dust must still be mixed with the ionized gas. It is possible, that process of sputtering or shattering is not so efficient as thought, and the resulting small particles still remain in the ionized part of nebulae (see e.g., Lenzuni et al. 1989).
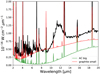 |
Fig. 3 Observed ISO spectrum (black) and results of models with only big cool dust (green line), and big cool and additional smaller grains (red line). |
4 Special features modeling
Both 11.5 and 30 μm features are clearly observed in the IR spectrum of IC 418. We explored the emission of SiC and MgS as usual suspects for these features.
4.1 The 30 μm band
For the 30 μm broad feature, we adopt MgS spherical (Mie theory) and ellipsoidal grains (van de Hulst 1957; Bohren & Huffman 1983). The optical constants are obtained from Jena database1. This database offers optical n and k data from 10 to 50 μm. Since no data are available at shorter wavelengths where absorption occurs, we choose to extrapolate them on the basis of the BE1 amorphous carbon data which are included in the Cloudy distribution (Rouleau & Martin 1991). For larger wavelengths, we extrapolate a constant value for n, and an inverse wavelength law for k.
The size distribution is following a −3.5 slope power law between 0.005 and 0.25 μm. The grains are in the whole nebula. Following the case of the graphite and amorphous carbon described in the previous sections, we use ten different sizes to cover this size range.
The Jena database offers data from Mg0.9Fe0.1S to FeS. We explored the extreme values of these molecules and found that FeS does not lead to emission comparable to the observations. We used the Mg0.9Fe0.1S for the rest of the study. The ellipsoidal approximation is obtained by applying Hony et al. (2002) procedure to convert spherical optical data into ellipsoidal ones, defined by their three semi-axes ratios a:b:c.
We explored spherical grains and five ellipsoidal morphologies corresponding to a:b:c = 3:1:1, 3:3:1, 6:1:1, 6:3:1, and 6:6:1. Figure 4 shows the emission obtained for these grains. These results are very comparable to the ones obtained by Hony et al. (2002, see their Fig. 8). The main effect of changing the shape of the grains is shifting the emission to larger wavelengths compared to spherical case (green line in Fig. 4). None of these single morphology emissions can reproduce the observation. A mixture of these morphologies is then used by running models where different contribution of each shape to thetotal amount of grain are considered. We converged a grid of models to the best fit, obtained by minimizing a χ2 between 25 and 40 μm. We note that, contrary to the case of featureless emission like the one of amorphous carbon for which the grain temperature largely determine the location of the emission peak, the emission of MgS (and SiC) is not significantly changed when the temperature changes.
Using this combination of ellipsoidal grains leads to a better fit to the observations. The best model presented in Fig. 8 (see Sect. 5) shows in lower right panel the fit of the 30 μm feature. We see that 30 μm feature is reproduced fairly well.
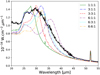 |
Fig. 4 Emission of MgS grains of different shapes. IC 418 ISO observation is in black. |
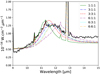 |
Fig. 5 Emission of SiC grains of different shapes. IC 418 ISO observation is in black. |
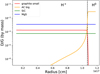 |
Fig. 6 D/G by mass for the different types of dust grains. The vertical dashed line delimits the H+ region and the PDR. For the SiC and MgS dust types, the D/G considers the sum of D/Gs for all the shapes for the best model (5 ellipsoidal and 1 spherical, see Table 2). |
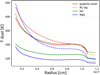 |
Fig. 7 Dust temperature for different grain sizes. Each color corresponds to different grain types: green and blue represent canonical distribution of dust sizes in case of SiC and MgS, while red and yellow represent small and big size distributions, respectively. Graphite and amorphous carbon grains are only present in H+ and PDR regions, respectively. For each dust type, solid and dashed lines represent the biggest and smallest size in each grain size distribution. Only spherical SiC and MgS grains are shown. |
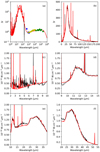 |
Fig. 8 Comparison between our best model and the observations. ISO data are black solid line, the model is red solid line. In panel a, red dots show IRAS data, blue dots show data reported by Hoare et al. (1992), yellow dots show data from Planck Collaboration Int. XVIII (2015), and green dots show radio observations (see Sect. 2). |
4.2 The 11.5 μm band
The 11.5 μm band has also been observed by the spectrograph on board the Spitzer Space Telescope, see Fig. 1 from Díaz-Luis et al. (2018). A correction factor is needed to make both Spitzer and ISO spectra match more or less, but in both observations the structure of the 11.5 μm band looks the same.
SiC emission is obtained by including dielectric data from Pegourie (1988) in Cloudy. These data are between 0.1 and 243 μm. At shorter wavelengths, for n we extrapolated on the basis of the BE1 amorphous carbon from Cloudy distribution (Rouleau & Martin 1991) and for k weextrapolate using a power law of slope 2. For longer wavelengths, for n we extrapolate a constant value and for k a power law of slope −1.
We used the same method as for MgS to obtain the optical properties for ellipsoidal grains. The resulting emission is shown in Fig. 5 with the observed spectrum. The canonical size distribution is following a −3.5 slope power law between 0.005 and 0.25 μm. The grains are in the whole nebula. We used ten different sizes to cover this size range.
The best fit, obtained by minimizing a χ2 between 9 and 16 μm, is presented in Fig. 8, center right panel (see Sect. 5). The fit is still not perfect and we may try other optical properties when available or other type of grains.
5 Best model
Some basic properties of our best model for each region (H+ and PDR) are given in Table 1. Our best model is obtained by adding four dust types (namely, amorphous carbon, graphite, SiC, and MgS) of different size distributions, shapes, and even position in the nebula. All the grains are distributed into ten size bins each. Additionally, SiC and MgS grains use six shapes each. This finally leads to 140 different grains included in the Cloudy model. All these properties are summarized in Table 2, where the dust-to-gas ratio by mass are given for each grain type.
In Fig. 6 we plot the D/G (by mass) for the different grains types. While some of them are constant over the whole nebula, others are only in one part: big amorphous carbon grains are mostly in the H0 (external) region (see Appendix A for details of their distribution), and small graphite grains in the H+ (inner) region. MgS and SiC grains (see previous sections) are in the whole nebula. For these grains, we plot the sum of D/Gs for all the shapes. Molar masses for C, Mg0.9Fe0.1S, and SiC are 12.0, 59.5, and 40.1, respectively. The density for MgS is 2.7 g cm−3 (Ropp 2012); we then use 3.05 g cm−3 for Mg0.9Fe0.1S. For SiC we use 3.21 g cm−3 (Patnaik 2003).
In Fig. 7 we show the variation of the dust temperature among the radius for different grain sizes and types, biggest grains (solid lines) being cooler. In the case of SiC and MgS, the effect of the shape on the temperature (not shown here) is significantly smaller than the effect of the size, for a given grain type.
In Fig. 8 we present the comparison between our best model and the observations, for various wavelength ranges and using various units for the fluxes. The emission lines are not aimed to be compared in these figures, as the wavelengths meshes are not comparable. Emission lines in the Cloudy output appears most of the time on only one pixel, leading to triangle profiles. We concentrated here on the dust continuum emission. Panels a and b show the whole fit using Jy unit, from 1 μm to 1 m (in log scale) and from 2 to 200 μm in linear scale, respectively. Some observations obtained through spectral bands (see caption) are also plotted in panel a. In Fig. 9 we present enlargement of panel a, in which we compare the observation and the model fluxes for the radio wavelength range. The total energy emitted by the nebula is 1.13 × 1037 erg s−1, of which almost 65% is emitted above 2.5 μm (42% from the H+ region and 23% from the PDR) leading to a total of 7.4 × 1036 erg s−1, including the small contribution from the emission lines of ~2 × 1035 erg s−1. The other panels show close-ups at some wavelength ranges: panel c shows the 2–10 μm range, where the small grains mainly emits; panels d–f show the SiC and MgS emissions. As we can see from Fig. 8, the best fit reasonably well reproduces the infrared continuum and the main dust features at 11.5 and 30 μm, with clear discrepancy between 12 and 25 μm. This discrepancy suggests that some specific dust component was not taken into account during modeling, and is discussed in Sect. 6. As a final result, we report in Table 3 the abundances of some elements in the gaseous phase and in the dust, as well as the total value and the solar values.
In Fig. 10 we show the optical depth of the nebula relative to the wavelength, ranging from X-rays to radio. We can see that neither the scattering nor the absorption is close to be optically thick in the IR range we are modeling in this work. Thus, we are convinced that radiative transfer in Cloudy gives reasonable results.
Properties of all the dust types and shapes of the grains used in our best model.
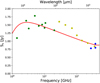 |
Fig. 9 Red solid line is the fit of the model at longer wavelengths. The dots are observations from different authors: green dots are radio observations (see Sect. 2), yellow dots are data from Planck Collaboration Int. XVIII (2015) and blue dots are data reported by Hoare et al. (1992). |
Abundances (by number, in log) of some elements in PN IC 418.
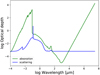 |
Fig. 10 Optical depth of the best model over a spectral range from X-rays to Radio. Effect of scattering and absorption are separated. |
6 Discussion
The model presented in the previous section as our best fit suffers some defects coming from the simplifications that could be improved in a future work. For example, the broad 30 μm feature could perhaps be better reproduced using grains with SiC core coated with MgS mantles as described by Zhukovska & Gail (2008).We tried FeS and MgS without any success in reproducing the observed spectrum.
We were able to compare the gaseous and total abundances, and obtain with the ones derived by Dopita et al. (2017). We found comparable values for all the elements in the gaseous phase (except for Si, which is determined from a line emitted by the PDR, not taken into account by Dopita et al. 2017). On the other side, the difference is very important when comparing the abundances in the dust phase: the values obtained by Dopita et al. (2017) are systematically higher than ours (except for S/H). The values given by Dopita et al. (2017) are not obtained by fitting the IR emission, but rather by applying the dust depletion factor determined by Jenkins (2009), normalized by the Fe/H depletion. The depletion of iron in IC 418 is quite puzzling, and should perhaps not be taken as reference for the other elements; it is the most important depletion observed for iron in PNe (Delgado-Inglada et al. 2016). As an illustration, our total value for log(Mg/H) is −4.78, while it is −3.68 in Dopita et al. (2017), values that may be compared to the solar value of −4.47. Our results have obvious limitations, but the total abundances we obtain are at least lower or close to the solar values (except for C/H, which is mainly in the gaseous phase and only constraint in the ionized region).
Our main goal for this work was to explain the depletion of Mg, Si, S, and Fe in the ionized nebula by their presence in form of dust grains. The model presented here, which reproduces the global energy budget of the IR dust emission, and therefore should involve the right amount of dust, still predicts too low abundances of these elements compared to the solar value (which is a valid reference for IC 418). We actually found that, for example, the amount of Mg and Fe embedded in Mgx Fe1−xS is not enough to reach the solar value, see Table 3.
Some under-abundant elements may be incorporated into missing dust component (see discussion of Fig. 11). One the other side, S/H is solar once adding the gaseous and dusty phases. This is in clear contradiction with what is found by Zhang et al. (2009), who argue that the amount of MgS (estimated from the available sulfur), which is necessary to reproduce the IR emission on the proto-PN HD 56126, is much higher than the amount available for this object.
We must mention here that we have not taken into account the effects of coating. The coating can hide elements inside grains that do not show their presence by the emission defined by their surface composition. It also increases the apparent element abundance of an element that is only present on the surface of the grains. The coating may also be different between the ionized region and the PDR.
In Fig. 11 we show the ratio between the observations and our best fit, between 9 and 37 μm. The feature drawn here is well above the noise and can be due to our poor knowledge of the optical properties of the MgS and SiC emissions, but it may also correspond to an unknown carrier.
The very broad feature between 15 and 25 μm could be due to some kind of solid with a mixed aromatic and aliphatic structure. Similar broad emission plateaus observed in C-rich dust PNe like IC 418, for example, at ~8 and 12 μm, have been suggested to emerge from mixed aromatic–aliphatic organic nanoparticles (the MAON model proposed by Kwok & Zhang 2011). Such an organic component is missing in our model and its inclusion could affect the results of our IR modeling. In the MAON model, the mixed aromatic–aliphatic grains may be very diverse and complex (e.g., even including other atoms, apart from C and H, such as N, O, and S). For example, laboratory spectra of some hydrogenated amorphous carbon (HAC) samples, being just a particular case of these mixed aromatic–aliphatic MAON grains display broad emission features at 21 and 30 μm (e.g., Grishko et al. 2001). Such a dust component could explain also the formation of complex dehydrogenated organics like fullerenes (e.g., García-Hernández et al. 2010, 2012) that are known to be present in IC 418 and other C-rich PNe (e.g., Otsuka et al. 2014, and references therein). Unfortunately, we do not have the optical constants of these MAON-like particles, except for a few specific HAC samples (W. Duley, priv. comm.). Preliminary modeling using this limited HAC data does not show the broad ~12–25 μm feature observed in IC 418 (Morisset et al., in prep.).
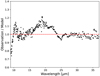 |
Fig. 11 Ratio between observation and our best model for wavelengths from 9 to 37 μm. |
7 Conclusions
This is the first time, to our knowledge, that a full ionized region + PDR model of a PN is presented that fits the IR emission from 2 to 200 μm, including the special features observed at 11.5 and 30 μm (the very detailed and complete model of NGC 6781 presented by Otsuka et al. 2017 does not include these features since they are not detected in that object). We succeed in reproducing the whole budget as well as those two broad emission features, with graphite, amorphous carbon, SiC, and MgS grains. The observed emission at short wavelengths (2–9 μm) is reproduced by small graphite grains located in the H+ region, while the long wavelength emission (50–200 μm) is due to carbon big grains located in the H0 (also called PDR) region. Adding the contribution from these dust grains to the abundances of the elements already present in the gaseous form allow us to determine their total abundances.
Our IR modeling presented here (i.e., the nature of the different dust components) might be proved or disproved by upcoming space-based IR facilities such as the James Webb Space Telescope (JWST). For example, high- spatial resolution imaging with the MIRI instrument on board JWST may provide the relative spatial distribution of all these dust species to be compared with the spatial distribution found by our IR modeling. All the files needed to run the model presented in this work as well as the outputs of the Cloudy model are available on the web site https://github.com/Morisset/IC418.
Acknowledgments
This work is supported by grants DGAPA/PAPIIT-107215 and CONACyT-CB2015-254132. V.G.-L. received support from CONACyT graduated students grants, and from PAEP-DGAPA program from UNAM. R.S. acknowledges support from the Polish NCN grant 2011/01/B/ST9/02031. D.A.G.-H. acknowledges support provided by the Spanish Ministry of Economy and Competitiveness (MINECO) under grant AYA−2014−58082-P. We thanks Peter van Hoof, who helped on running complex Cloudy dusty models and made some comments on the draft. Discussions with Peter van Hoof and Gary Ferland helped a lot to clarify the limitations of Cloudy. We thank the referee for the useful comments we received, improving the quality of the paper.
Appendix A Degeneracy between dust size and distance to the heating source
To explore the role of the grain size and the distance of the grain to the central source, we run some toy models using single size BE1 amorphous carbon dust grains. A model with canonical size of 0.01 μm is shown in red in Fig. A.1. The emission is clearly too hot (peaking at to short wavelengths).
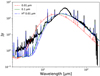 |
Fig. A.1 Observed ISO spectrum (black) and results of models with small dust (red dashed), bigger grains (green solid), and small grains only in the PDR (blue dash-doted). |
To reduce the temperature of the grains and shift the emission to longer wavelengths, we tested two options: (1) increasing the size of the grains (0.1 μm, green line) and (2) having the dust the canonical size, but distributed only in the PDR (blue line in Fig. A.1). This latest option is achieved by applying a scale factor to the dust abundance. In our case, the scale factor is the hydrogen atomic fraction, small when gas is ionized and unity when atomic. The two options clearly move the emission toward the longer wavelengths, allowing the fit between 50 and 200 μm to be quite good and leading to a degeneracy between the size of the grains and their position in the nebula.
An interesting result of exploring this degeneracy is that in both cases, the total dust mass required to obtain two very close emissions are very similar. It is difficult to really prefer one of the two options only comparing the fits, and the real situation may also be any smooth combination of both of them: grains being bigger and denser (in terms of dust-to-gas ratio) with the increasing distance to the star. For the final model, we choose to combine both cases: big grains, but only in the H0 region.
References
- Abrahamsson, E., Krems, R. V., & Dalgarno, A. 2007, ApJ, 654, 1171 [NASA ADS] [CrossRef] [Google Scholar]
- Asplund, M., Grevesse, N., Sauval, A. J., & Scott, P. 2009, ARA&A, 47, 481 [NASA ADS] [CrossRef] [Google Scholar]
- Barlow, M. J. 1978, MNRAS, 183, 367 [NASA ADS] [CrossRef] [Google Scholar]
- Bohren, C. F., & Huffman, D. R. 1983, Absorption and Scattering of Light by Small Particles (Wiley-VCH Verlag GmbH) [Google Scholar]
- Cahn, J. H., Kaler, J. B., & Stanghellini, L. 1992, A&AS, 94, 399 [NASA ADS] [Google Scholar]
- Dayal, A., & Bieging, J. H. 1996, ApJ, 472, 703 [NASA ADS] [CrossRef] [Google Scholar]
- Delgado-Inglada, G., Mesa-Delgado, A., García-Rojas, J., Rodríguez, M., & Esteban, C. 2016, MNRAS, 456, 3855 [NASA ADS] [CrossRef] [Google Scholar]
- Díaz-Luis, J. J., García-Hernández, D. A., Manchado, A., et al. 2018, AJ, 155, 105 [NASA ADS] [CrossRef] [Google Scholar]
- Dixon, R. S. 1970, ApJS, 20, 1 [Google Scholar]
- Dopita, M. A., Groves, B. A., Fischera, J., et al. 2005, ApJ, 619, 755 [NASA ADS] [CrossRef] [Google Scholar]
- Dopita, M. A., Ali, A., Sutherland, R. S., Nicholls, D. C., & Amer, M. A. 2017, MNRAS, 470, 839 [NASA ADS] [CrossRef] [Google Scholar]
- Draine, B. T., & Salpeter, E. E. 1979, ApJ, 231, 438 [NASA ADS] [CrossRef] [Google Scholar]
- Ferland, G. J., Korista, K. T., Verner, D. A., et al. 1998, PASP, 110, 761 [Google Scholar]
- Ferland, G. J., Chatzikos, M., Guzmán, F., et al. 2017, Rev. Mex. Astron. Astrof., 53, 385 [Google Scholar]
- Ferrarotti, A. S., & Gail, H.-P. 2006, A&A, 447, 553 [NASA ADS] [CrossRef] [EDP Sciences] [Google Scholar]
- Fitzpatrick, E. L. 1999, PASP, 111, 63 [NASA ADS] [CrossRef] [Google Scholar]
- Forrest, W. J., Houck, J. R., & McCarthy, J. F. 1981, ApJ, 248, 195 [NASA ADS] [CrossRef] [Google Scholar]
- García-Hernández, D. A., Manchado, A., García-Lario, P., et al. 2010, ApJ, 724, L39 [NASA ADS] [CrossRef] [Google Scholar]
- García-Hernández, D. A., Villaver, E., García-Lario, P., et al. 2012, ApJ, 760, 107 [NASA ADS] [CrossRef] [Google Scholar]
- Goebel, J. H.,& Moseley, S. H. 1985, ApJ, 290, L35 [NASA ADS] [CrossRef] [Google Scholar]
- Grishko, V. I., Tereszchuk, K., Duley, W. W., & Bernath, P. 2001, ApJ, 558, L129 [NASA ADS] [CrossRef] [Google Scholar]
- Hillier, D. J., & Miller, D. L. 1998, ApJ, 496, 407 [NASA ADS] [CrossRef] [Google Scholar]
- Hoare, M. G. 1990, MNRAS, 244, 193 [NASA ADS] [Google Scholar]
- Hoare, M. G., Roche, P. F., & Clegg, R. E. S. 1992, MNRAS, 258, 257 [NASA ADS] [CrossRef] [Google Scholar]
- Hony, S., Waters, L. B. F. M., & Tielens, A. G. G. M. 2002, A&A, 390, 533 [NASA ADS] [CrossRef] [EDP Sciences] [Google Scholar]
- Ishiki, S., Okamoto, T., & Inoue, A. K. 2018, MNRAS, 474, 1935 [NASA ADS] [CrossRef] [Google Scholar]
- Jenkins, E. B. 2009, ApJ, 700, 1299 [NASA ADS] [CrossRef] [Google Scholar]
- Kwok, S., & Zhang, Y. 2011, Nature, 479, 80 [NASA ADS] [CrossRef] [PubMed] [Google Scholar]
- Lenzuni, P., Natta, A., & Panagia, N. 1989, ApJ, 345, 306 [NASA ADS] [CrossRef] [Google Scholar]
- Liu, X., Barlow, M. J., Cohen, M., et al. 2001, MNRAS, 323, 343 [NASA ADS] [CrossRef] [Google Scholar]
- Morisset, C. 2006, in Planetary Nebulae in Our Galaxy and Beyond, eds. M. J. Barlow & R. H. Méndez, IAU Symp., 234, 467 [NASA ADS] [CrossRef] [Google Scholar]
- Morisset, C. 2014, in Asymmetrical Planetary Nebulae VI Conference, Proceedings of the Conference Held 4-8 November, 2013, eds. C. Morisset, G. Delgado-Inglada, & S. Torres-Peimbert [Google Scholar]
- Morisset, C., & Georgiev, L. 2009, A&A, 507, 1517 [NASA ADS] [CrossRef] [EDP Sciences] [Google Scholar]
- Moseley, H., & Silverberg, R. F. 1985, in NASA Conference Publication, 2353, 233 [Google Scholar]
- Moseley, H., & Silverberg, R. F. 1986, in NASA Conference Publication, 2403, eds. J. A. Nuth, III & R. E. Stencel [Google Scholar]
- Murphy, T., Sadler, E. M., Ekers, R. D., et al. 2010, MNRAS, 402, 2403 [NASA ADS] [CrossRef] [Google Scholar]
- Otsuka, M., Kemper, F., Cami, J., Peeters, E., & Bernard-Salas, J. 2014, MNRAS, 437, 2577 [NASA ADS] [CrossRef] [Google Scholar]
- Otsuka, M., Ueta, T., van Hoof, P. A. M., et al. 2017, ApJS, 231, 22 [NASA ADS] [CrossRef] [Google Scholar]
- Patnaik, P. 2003, Handbook of Inorganic Chemicals, McGraw-Hill Handbooks (New York, NY: McGraw-Hill) [Google Scholar]
- Pegourie, B. 1988, A&A, 194, 335 [NASA ADS] [Google Scholar]
- Phillips, J. P., Mampaso, A., Vilchez, J. M., & Gomez, P. 1986, Ap&SS, 122, 81 [NASA ADS] [Google Scholar]
- Planck Collaboration Int. XVIII. 2015, A&A, 573, A6 [NASA ADS] [CrossRef] [EDP Sciences] [Google Scholar]
- Pottasch, S. R., Bernard-Salas, J., Beintema, D. A., & Feibelman, W. A. 2004, A&A, 423, 593 [NASA ADS] [CrossRef] [EDP Sciences] [Google Scholar]
- Ropp, R. 2012, Encyclopedia of the Alkaline Earth Compounds (Amsterdam, The Netherlands: Elsevier Science) [Google Scholar]
- Rouleau, F., & Martin, P. G. 1991, ApJ, 377, 526 [NASA ADS] [CrossRef] [Google Scholar]
- Shields, G. A. 1983, in Planetary Nebulae, ed. D. R. Flower, IAU Symp., 103, 259 [NASA ADS] [Google Scholar]
- Sutherland, R. S., & Dopita, M. A. 2017, ApJS, 229, 34 [NASA ADS] [CrossRef] [Google Scholar]
- Treffers, R., & Cohen, M. 1974, ApJ, 188, 545 [NASA ADS] [CrossRef] [Google Scholar]
- van de Hulst, H. C. 1957, Light Scattering by Small Particles (London, UK: Chapman and Hall) [Google Scholar]
- Volk, K., Dinerstein, H., & Sneden, C. 1997, in Planetary Nebulae, eds. H. J. Habing & H. J. G. L. M. Lamers, IAU Symp., 180, 284 [NASA ADS] [Google Scholar]
- Vollmer, B., Gassmann, B., Derrière, S., et al. 2010, A&A, 511, A53 [NASA ADS] [CrossRef] [EDP Sciences] [Google Scholar]
- Weingartner, J. C., Draine, B. T., & Barr, D. K. 2006, ApJ, 645, 1188 [NASA ADS] [CrossRef] [Google Scholar]
- Willner, S. P., Jones, B., Russell, R. W., Puetter, R. C., & Soifer, B. T. 1979, ApJ, 234, 496 [NASA ADS] [CrossRef] [Google Scholar]
- Wright, A. E., Wark, R. M., Troup, E., et al. 1991, MNRAS, 251, 330 [NASA ADS] [CrossRef] [Google Scholar]
- Zhang, K., Jiang, B. W., & Li, A. 2009, ApJ, 702, 680 [NASA ADS] [CrossRef] [Google Scholar]
- Zhukovska, S., & Gail, H.-P. 2008, A&A, 486, 229 [NASA ADS] [CrossRef] [EDP Sciences] [Google Scholar]
All Tables
Properties of all the dust types and shapes of the grains used in our best model.
All Figures
|
Fig. 1 Electron temperature, electron density, and hydrogen density. |
| In the text | |
|
Fig. 2 Dust emission of amorphous carbon. The blue dashed line represents canonical size (0.005–0.25 μm) grains in the whole nebula, and the green solid line represents big (0.03–0.4 μm) grains only in the PDR. PN IC 418 observations are in black. |
| In the text | |
|
Fig. 3 Observed ISO spectrum (black) and results of models with only big cool dust (green line), and big cool and additional smaller grains (red line). |
| In the text | |
|
Fig. 4 Emission of MgS grains of different shapes. IC 418 ISO observation is in black. |
| In the text | |
|
Fig. 5 Emission of SiC grains of different shapes. IC 418 ISO observation is in black. |
| In the text | |
|
Fig. 6 D/G by mass for the different types of dust grains. The vertical dashed line delimits the H+ region and the PDR. For the SiC and MgS dust types, the D/G considers the sum of D/Gs for all the shapes for the best model (5 ellipsoidal and 1 spherical, see Table 2). |
| In the text | |
|
Fig. 7 Dust temperature for different grain sizes. Each color corresponds to different grain types: green and blue represent canonical distribution of dust sizes in case of SiC and MgS, while red and yellow represent small and big size distributions, respectively. Graphite and amorphous carbon grains are only present in H+ and PDR regions, respectively. For each dust type, solid and dashed lines represent the biggest and smallest size in each grain size distribution. Only spherical SiC and MgS grains are shown. |
| In the text | |
|
Fig. 8 Comparison between our best model and the observations. ISO data are black solid line, the model is red solid line. In panel a, red dots show IRAS data, blue dots show data reported by Hoare et al. (1992), yellow dots show data from Planck Collaboration Int. XVIII (2015), and green dots show radio observations (see Sect. 2). |
| In the text | |
|
Fig. 9 Red solid line is the fit of the model at longer wavelengths. The dots are observations from different authors: green dots are radio observations (see Sect. 2), yellow dots are data from Planck Collaboration Int. XVIII (2015) and blue dots are data reported by Hoare et al. (1992). |
| In the text | |
|
Fig. 10 Optical depth of the best model over a spectral range from X-rays to Radio. Effect of scattering and absorption are separated. |
| In the text | |
|
Fig. 11 Ratio between observation and our best model for wavelengths from 9 to 37 μm. |
| In the text | |
|
Fig. A.1 Observed ISO spectrum (black) and results of models with small dust (red dashed), bigger grains (green solid), and small grains only in the PDR (blue dash-doted). |
| In the text | |
Current usage metrics show cumulative count of Article Views (full-text article views including HTML views, PDF and ePub downloads, according to the available data) and Abstracts Views on Vision4Press platform.
Data correspond to usage on the plateform after 2015. The current usage metrics is available 48-96 hours after online publication and is updated daily on week days.
Initial download of the metrics may take a while.