Fig. 11.
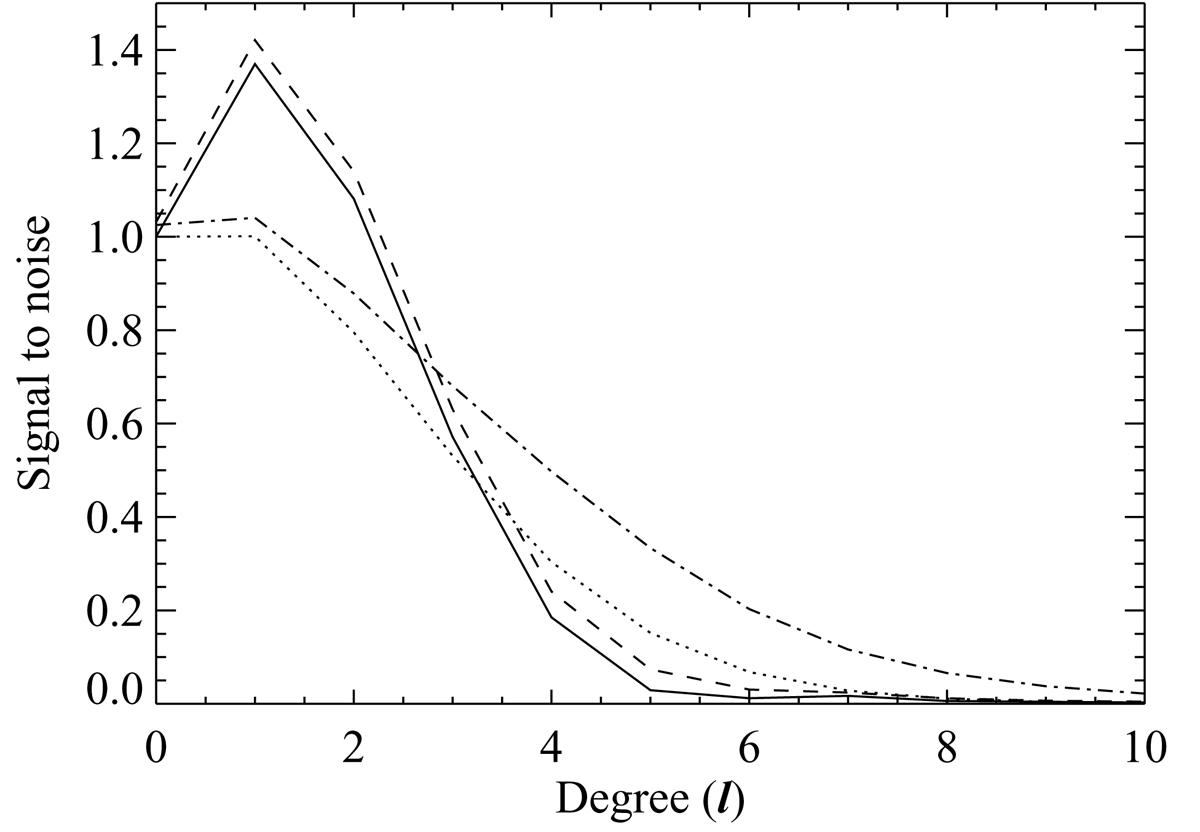
Signal to noise for various cases. Solid is cross-correlation is m = 0 for i = 0° and dashed the corresponding fits. The dotted line in-dicates the cross-correlation for m = l, 4 km s−1 equatorial rotation and i = 90° while the dash-dotted line indicates the corresponding fit. In all cases the absolute value of the signal-to-noise ratio is shown divided by the corresponding l = 0 cross-correlation value.
Current usage metrics show cumulative count of Article Views (full-text article views including HTML views, PDF and ePub downloads, according to the available data) and Abstracts Views on Vision4Press platform.
Data correspond to usage on the plateform after 2015. The current usage metrics is available 48-96 hours after online publication and is updated daily on week days.
Initial download of the metrics may take a while.