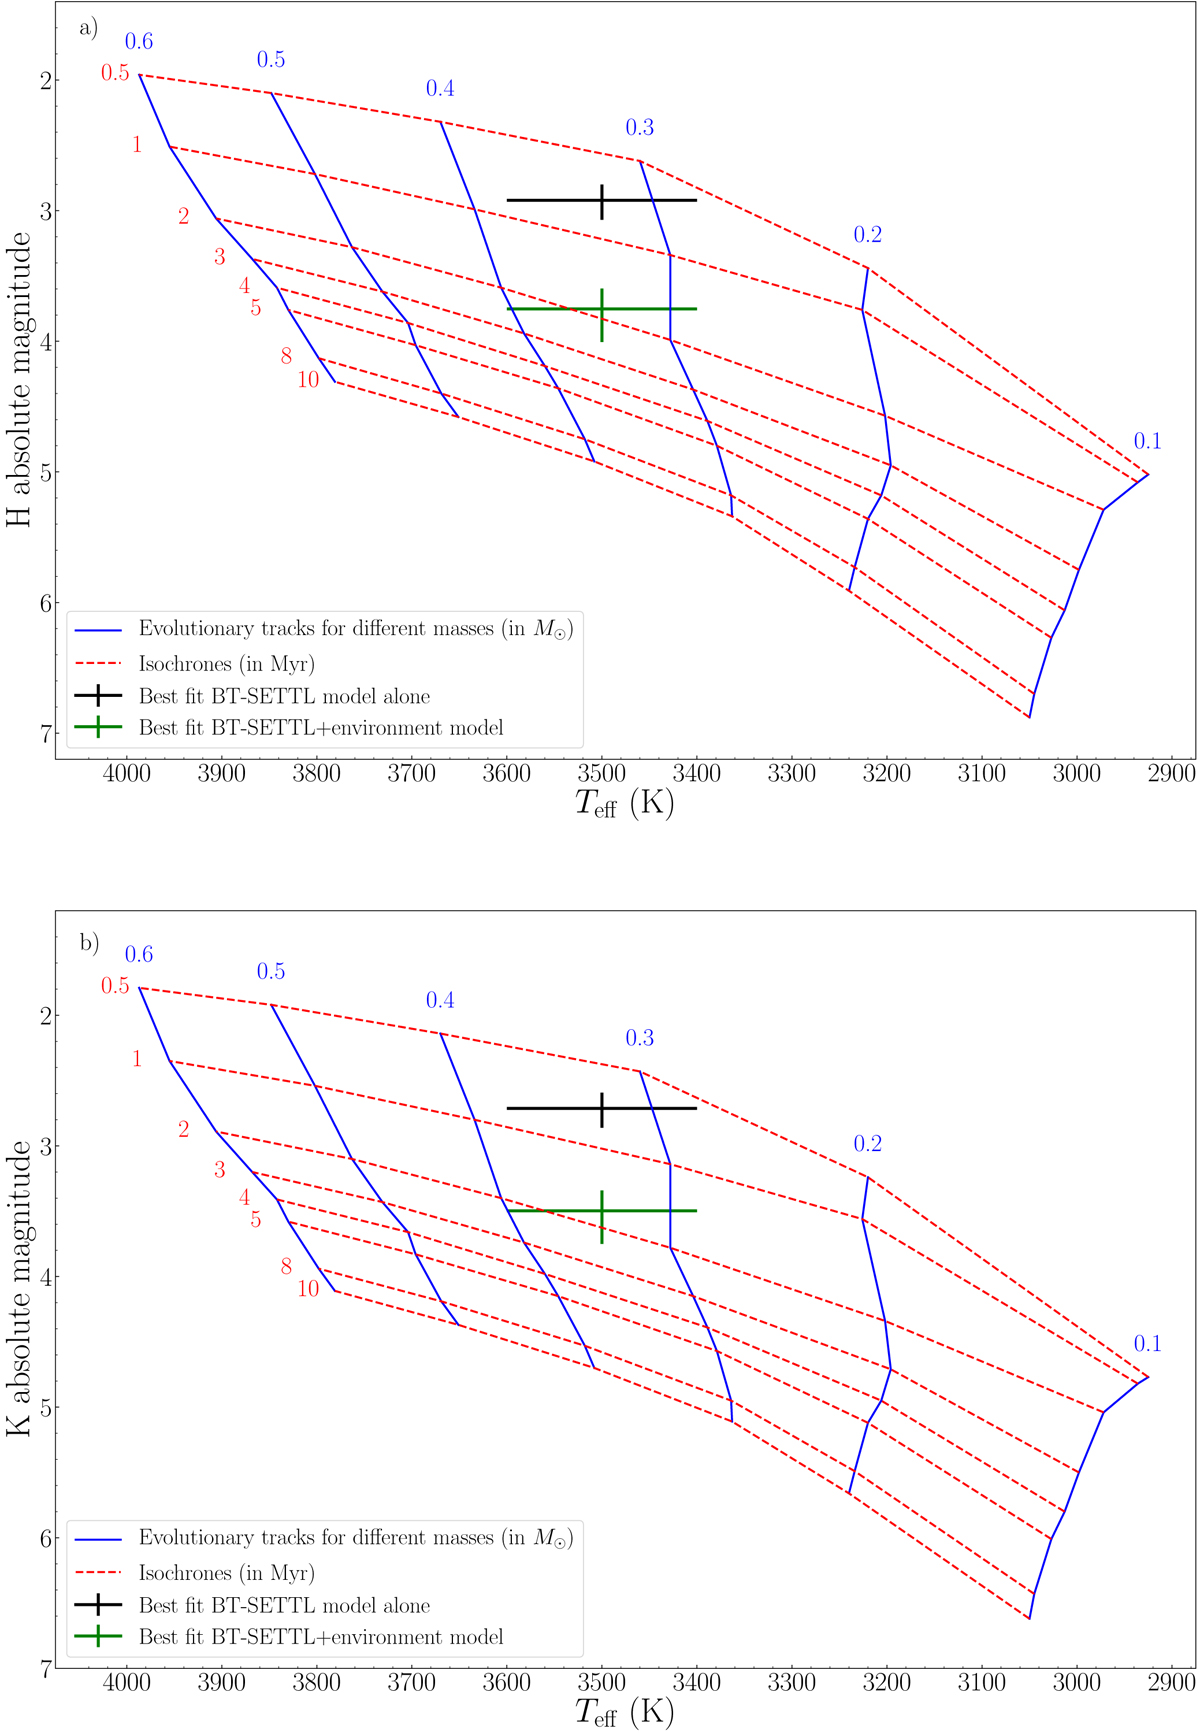
Fig. 9.

HR diagrams in H- (panel a) and K-band (panel b) showing stellar tracks for different masses according Baraffe et al. (2015) evolutionary models. Isochrones (red-dashed lines) range from 0.5 to 10 Myr. The evolutionary paths (blue lines) are considered for stellar masses ranging from 0.1 to 0.6 M⊙, per steps of 0.1 M⊙. The black and green error bars correspond to the best-fit Teff and dereddened absolute magnitude of the companion in case all the observed H + K signal is photospheric (case I) or made of a combination of photosphere+hot environment (case II).
Current usage metrics show cumulative count of Article Views (full-text article views including HTML views, PDF and ePub downloads, according to the available data) and Abstracts Views on Vision4Press platform.
Data correspond to usage on the plateform after 2015. The current usage metrics is available 48-96 hours after online publication and is updated daily on week days.
Initial download of the metrics may take a while.


