Fig. 6.
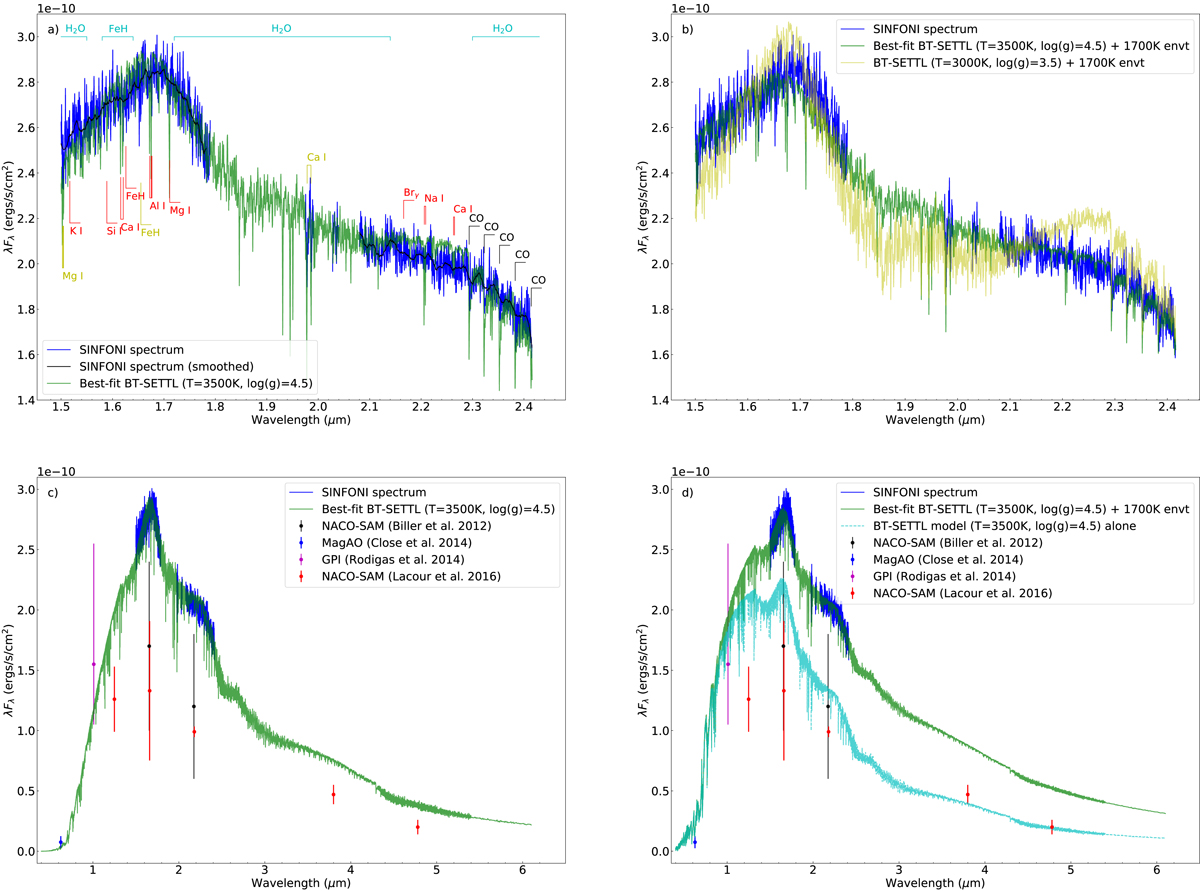
Panel a: observed H + K spectrum of HD 142527 B (blue curve) and spectrum after Savitzky-Golay filtering (black curve). The best-fit BT-SETTL synthetic spectrum is obtained with Teff = 3500 K and log(g) = 4.5 (green curve). For reference, we provide the location of spectral lines that are expected in the H + K spectrum of M-type stars. Lines labeled in black, yellow, and red are detected, tentatively detected, and non-detected in the SINFONI spectrum, respectively. Panel b: observed H + K spectrum of HD 142527 B (blue curve) compared to the best-fit BT-SETTL+black body model, representing the photospheric and hot circum-secondary environment contributions, respectively. The best fit is obtained with a Teff = 3500 K and log(g) = 4.5 BT-SETTL model, with a 1700 K environment (green curve). We also plot the model suggested in Lacour et al. (2016) consisting of a Teff = 3000 K and log(g) = 3.5 BT-SETTL model, with a 1700 K environment (yellow curve). Panel c: as in panel a but for a larger wavelength range. Panel d: as in panel b but for a larger wavelength range, but without the Lacour et al. (2016) model and showing the contribution of the photosphere of the companion (cyan curve) in our best-fit BT-SETTL+environment model. In both panels c and d, we compare our spectrum with photometric measurements of the companion obtained with different instruments: VLT/NACO-SAM (black points; Biller et al. 2012), MagAO (blue points; Close et al. 2014), GPI (magenta points; Rodigas et al. 2014) and VLT/NACO-SAM (red points; Lacour et al. 2016).
Current usage metrics show cumulative count of Article Views (full-text article views including HTML views, PDF and ePub downloads, according to the available data) and Abstracts Views on Vision4Press platform.
Data correspond to usage on the plateform after 2015. The current usage metrics is available 48-96 hours after online publication and is updated daily on week days.
Initial download of the metrics may take a while.