Fig. 5.
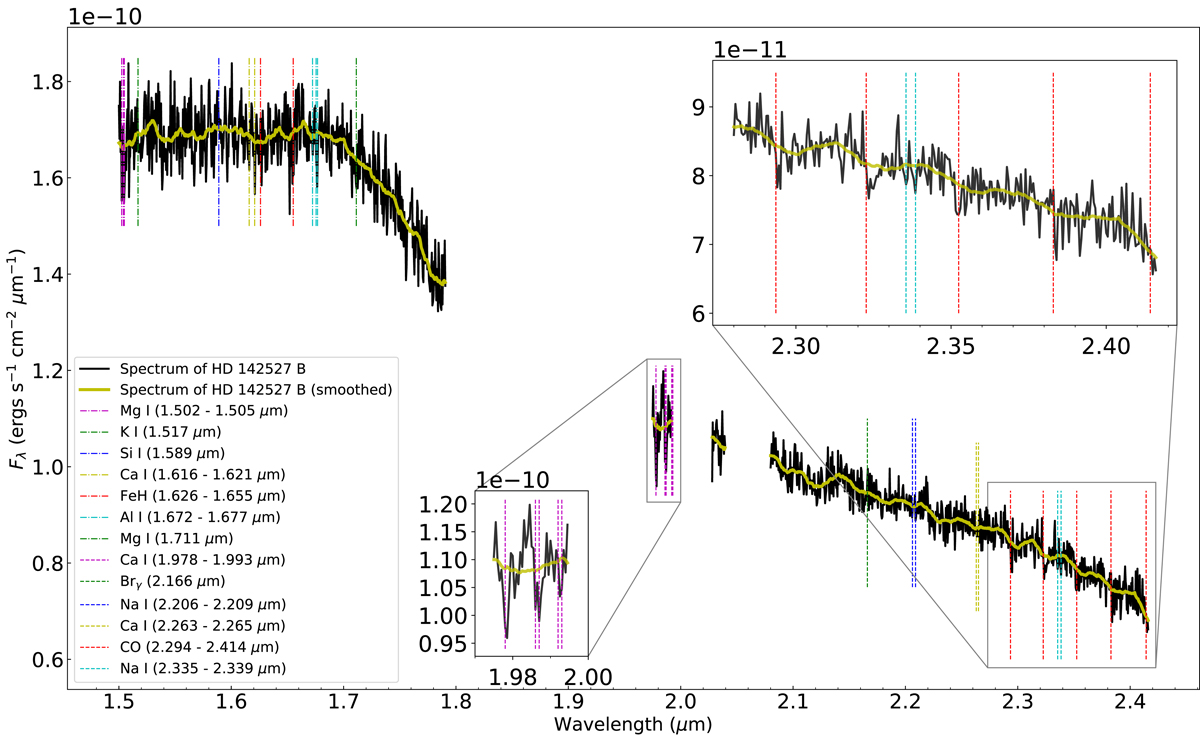
Observed H + K spectrum of HD 142527 B (black curve) and spectrum after Savitzky-Golay filtering (yellow curve), along with expected lines in the spectrum of an early to mid-M dwarf. Lines in H- and K-band are provided with dashed-dot and dashed lines, respectively. The combined presence of five tentative jumps at expected CO transitions (2.294, 2.323, 2.352, 2.383 and 2.414 μm) makes the detection of the first overtone of CO bandhead significant. The Ca I quintuplet (1.978, 1.986, 1.987, 1.992 and 1.993 μm) also appears to be detected, although this area is bordered by poorly corrected telluric features (not shown) which inspire caution. Insets zooming on the Ca I quintuplet and CO bandhead spectral regions are provided.
Current usage metrics show cumulative count of Article Views (full-text article views including HTML views, PDF and ePub downloads, according to the available data) and Abstracts Views on Vision4Press platform.
Data correspond to usage on the plateform after 2015. The current usage metrics is available 48-96 hours after online publication and is updated daily on week days.
Initial download of the metrics may take a while.