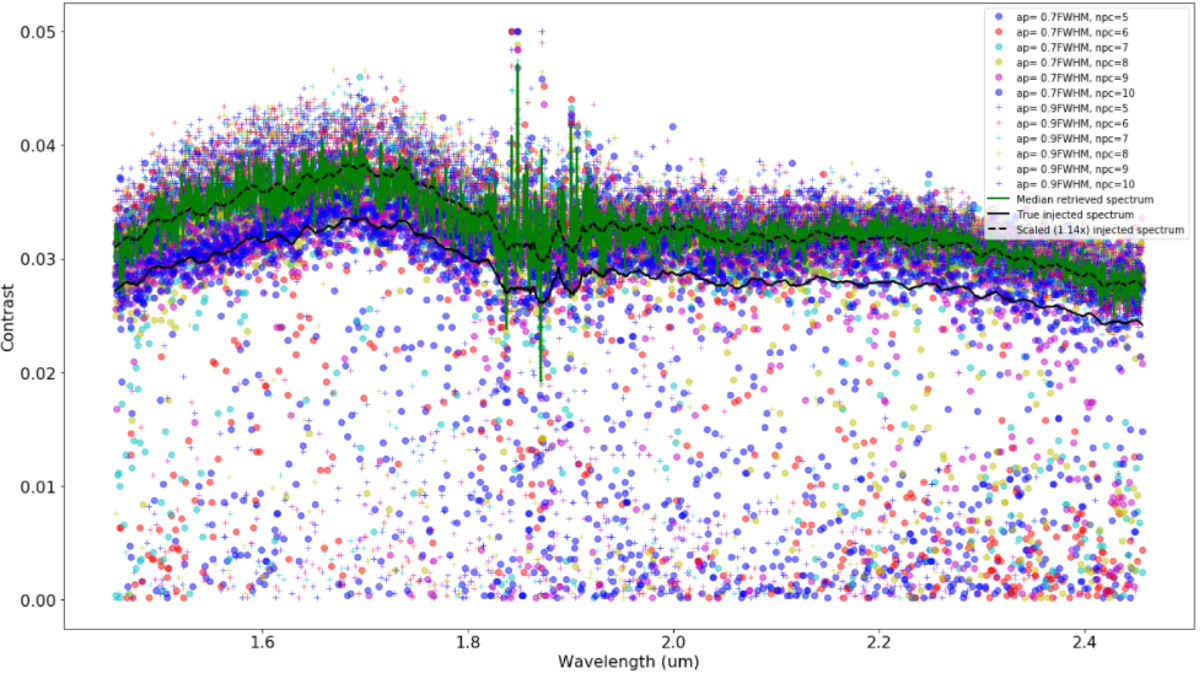
Fig. B.2.
Extracted spectrum of an artificially injected companion on top of the strongest speckle feature located at the same radial separation as the companion, at a PA of 240°. The true injected spectrum is shown with the solid black curve. The contrast of the companion is estimated in each spectral channel with different sets of NEGFC parameters: npc ∈ [5, 10] and apertures of 0.7 and 0.9 FWHM, using the standard deviation as figure of merit (see details in Sect. 3.2.2). For clarity, we do not show the contrast estimates using the sum as figure of merit, but do include these results in the median contrast spectrum obtained over all 24 reductions (green curve). The median retrieved contrast spectrum follows well the shape of the injected spectrum, but scaled up by a factor 1.14 (dashed black curve).
Current usage metrics show cumulative count of Article Views (full-text article views including HTML views, PDF and ePub downloads, according to the available data) and Abstracts Views on Vision4Press platform.
Data correspond to usage on the plateform after 2015. The current usage metrics is available 48-96 hours after online publication and is updated daily on week days.
Initial download of the metrics may take a while.