Fig. 1.
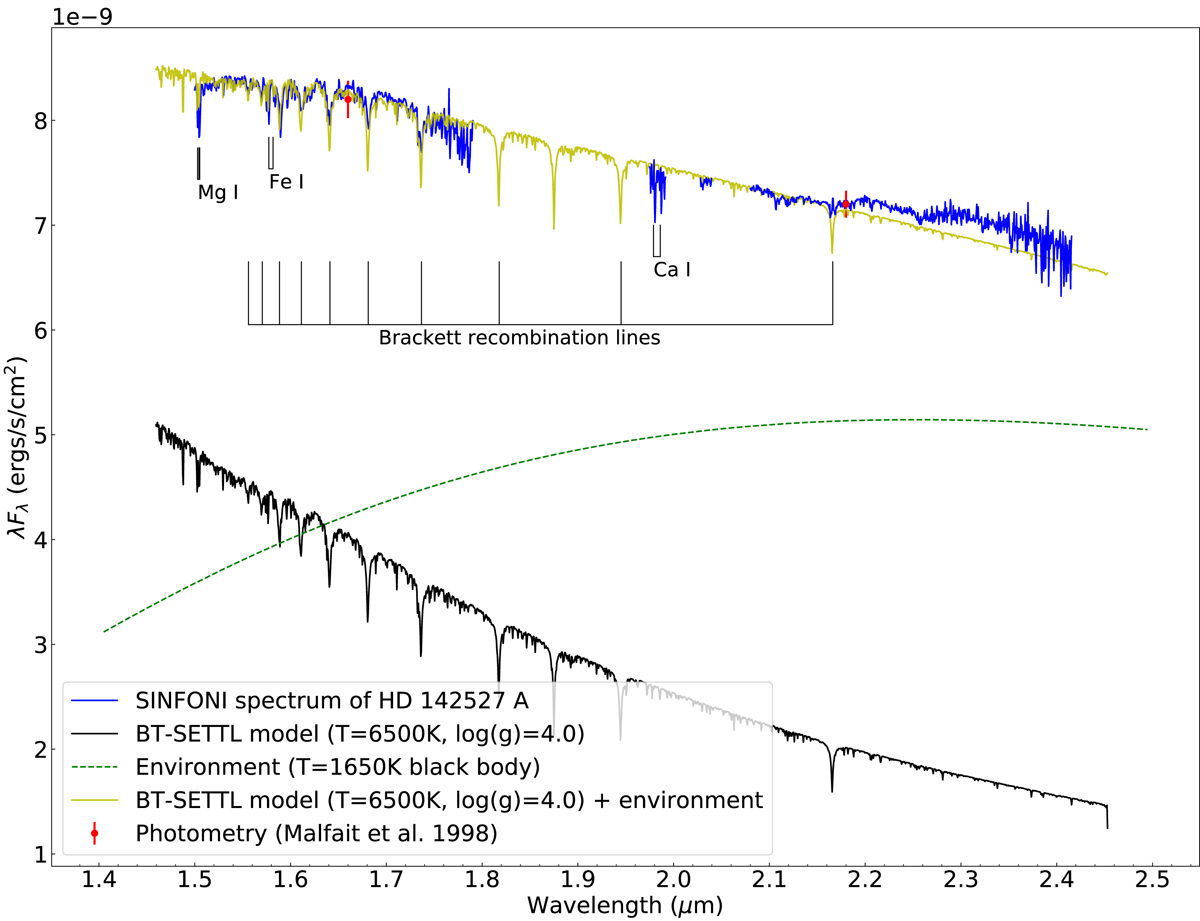
Observed spectrum of HD 142527 A after telluric and instrumental response corrections (blue curve). The yellow curve corresponds to the combination of a BT-SETTL model (T = 6500 K, log(g) = 4.0; black curve) and a black body of 1650 K (green dashed curve) representative of the hot inner disk rim. Blanks in the SINFONI spectrum correspond to spectral channels where telluric lines were poorly corrected, and are therefore discarded for the rest of the analysis.
Current usage metrics show cumulative count of Article Views (full-text article views including HTML views, PDF and ePub downloads, according to the available data) and Abstracts Views on Vision4Press platform.
Data correspond to usage on the plateform after 2015. The current usage metrics is available 48-96 hours after online publication and is updated daily on week days.
Initial download of the metrics may take a while.