Fig. 8.
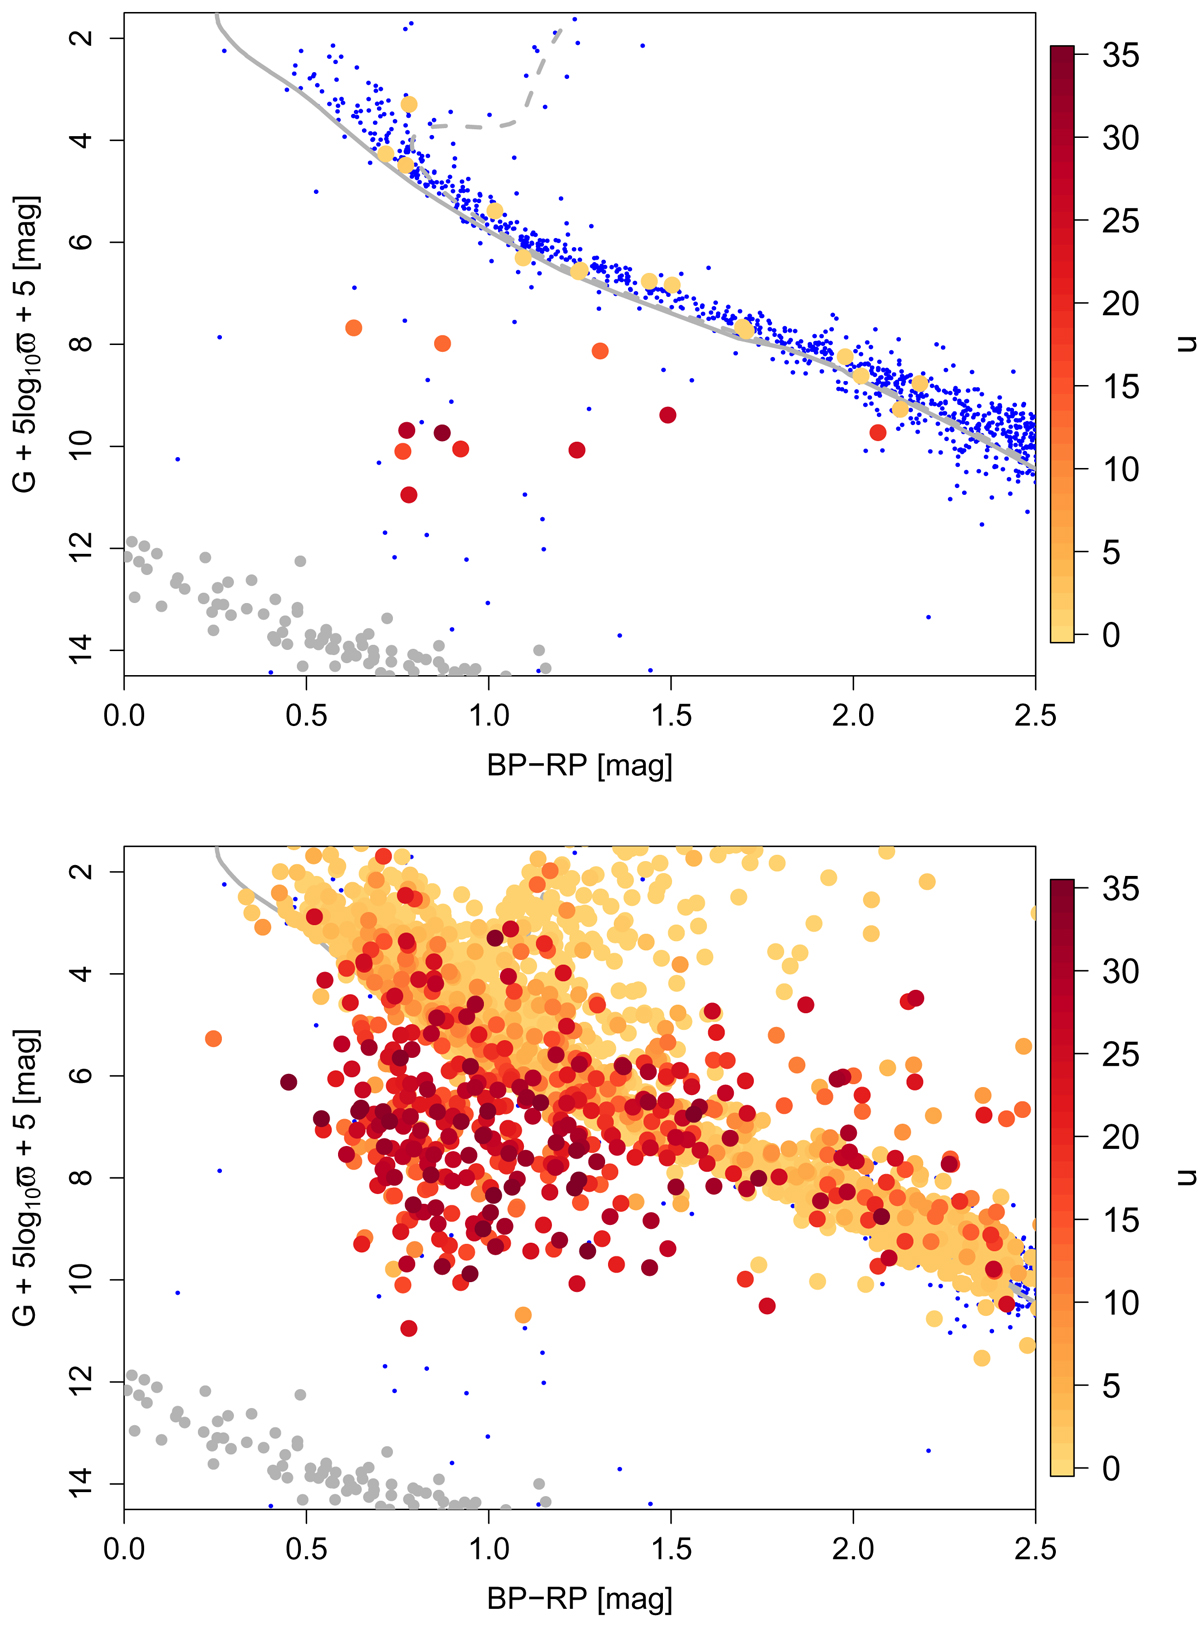
Colour–magnitude diagram for stellar encounters coloured according to the unit weight error u in Table 3. The vertical axis equals MG assuming extinction is zero. For orientation, the grey lines are unreddened solar metallicity PARSEC isochrones for 1 Gyr (solid) and 10 Gyr (dashed) from Marigo et al. (2017), the grey points are white dwarfs within 20 pc of the Sun identified by Hollands et al. (2018) (many lie outside the range of the plot), and the small blue dots show all sources in Gaia DR2 with ϖ > 50 mas (plotted on the bottom layer, so most are obscured by coloured and grey points, especially in the lower panel). The upper panel shows all reliable (non-bogus) encounters with ![]() < 1 pc (from Table 2). For comparison, the lower panel shows all encounters in the filtered sample (some lie outside the plotting range). Encounters have been plotted with larger values of u on higher layers so as to better locate larger values of u. The colour bar spans the full range of values in both panels.
< 1 pc (from Table 2). For comparison, the lower panel shows all encounters in the filtered sample (some lie outside the plotting range). Encounters have been plotted with larger values of u on higher layers so as to better locate larger values of u. The colour bar spans the full range of values in both panels.
Current usage metrics show cumulative count of Article Views (full-text article views including HTML views, PDF and ePub downloads, according to the available data) and Abstracts Views on Vision4Press platform.
Data correspond to usage on the plateform after 2015. The current usage metrics is available 48-96 hours after online publication and is updated daily on week days.
Initial download of the metrics may take a while.