Fig. 10.
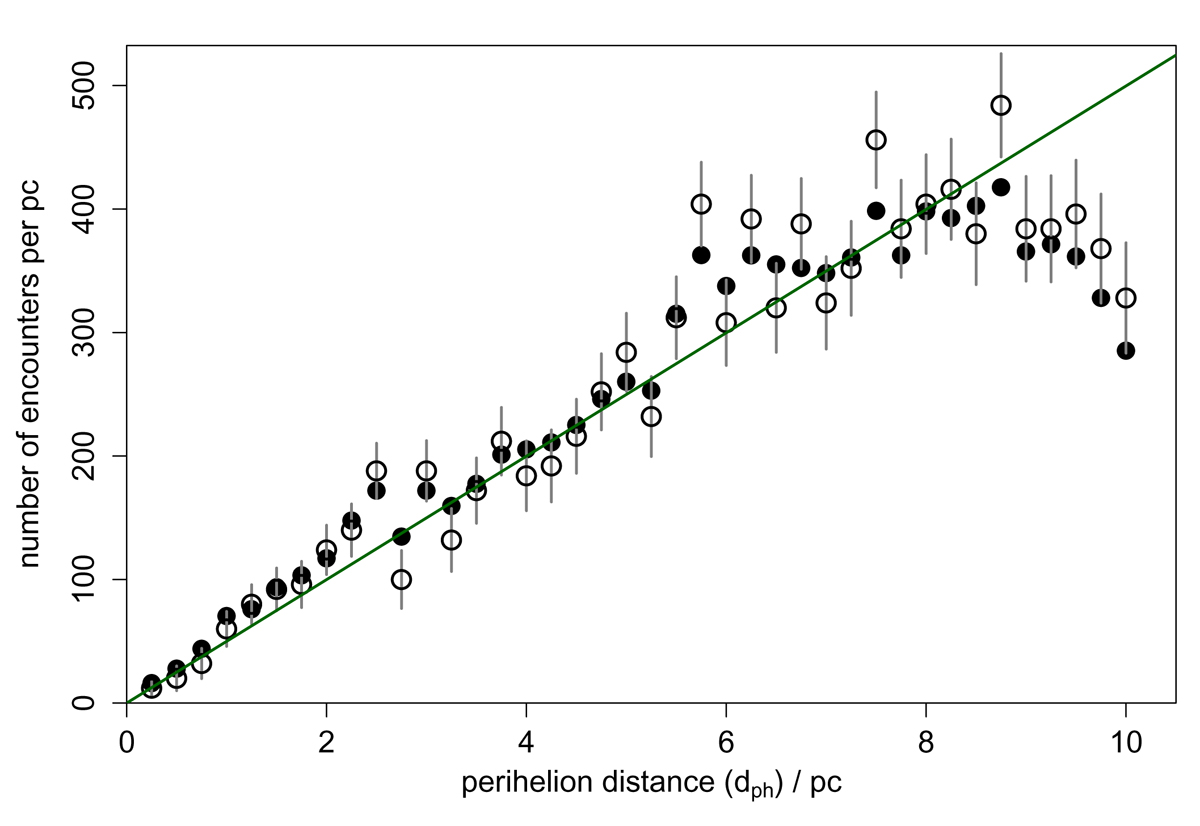
Variation of the number of observed encounters per unit perihelion distance as a function of perihelion distance (for the filtered sample for all tph). The open circles count the encountering stars discretely, using ![]() as the distance estimate for each star. The filled circles count each surrogate for each encountering star separately. The green line is the distribution we expect under the assumption that the distribution is linear. It has a gradient of 50.0 pc−1. (The number of encounters within some distance is the integral of this, i.e. ∝
as the distance estimate for each star. The filled circles count each surrogate for each encountering star separately. The green line is the distribution we expect under the assumption that the distribution is linear. It has a gradient of 50.0 pc−1. (The number of encounters within some distance is the integral of this, i.e. ∝ ![]() .) The data do not follow this near to the limit (at 10 pc) because not all stars found in the LMA-based selection actually come within 10 pc after doing the orbital integration. The error bars show the Poisson noise computed from the theoretical relation (only attached to the open points to avoid crowding).
.) The data do not follow this near to the limit (at 10 pc) because not all stars found in the LMA-based selection actually come within 10 pc after doing the orbital integration. The error bars show the Poisson noise computed from the theoretical relation (only attached to the open points to avoid crowding).
Current usage metrics show cumulative count of Article Views (full-text article views including HTML views, PDF and ePub downloads, according to the available data) and Abstracts Views on Vision4Press platform.
Data correspond to usage on the plateform after 2015. The current usage metrics is available 48-96 hours after online publication and is updated daily on week days.
Initial download of the metrics may take a while.