Fig. 5.
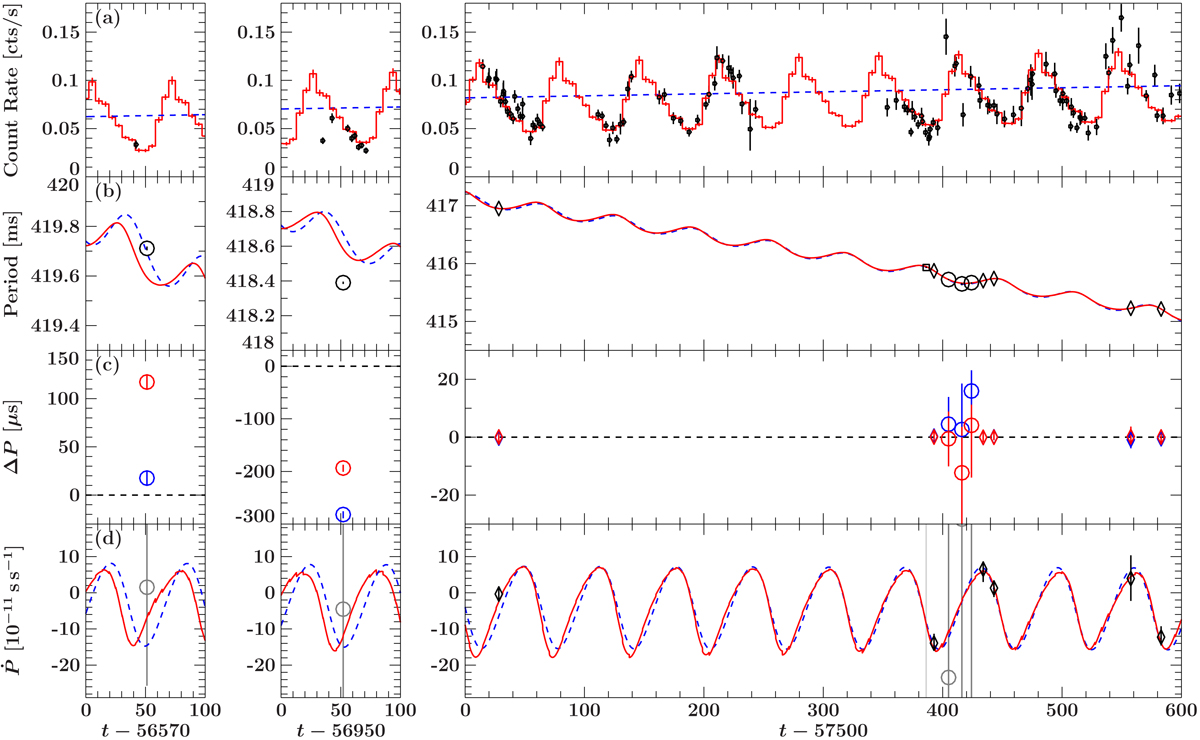
Panel a: Swift/XRT monitoring light curve in the 0.3–10 keV energy band. The three columns focus on epochs 2013, 2014, and 2016–2017. The red curve shows the light curve folded on a 66.9 d period plus a linear brightening trend; the blue dashed line only shows the linear trend. Panel b: measured values of the pulse period as a function of time. Diamonds indicate values taken with NuSTAR and circles values taken with XMM-Newton. The small square shows the period measured in observation 2017A with XMM-Newton, which did not provide a significant detection by itself. The red line is the best-fit model using the pulse profile as input; the blue dashed line a linear trend only. The model takes the secular spin-up as function of intrinsic luminosity and the orbital Doppler motion into account. For details see text. Panel c: residuals as data-minus-model for both models (red: pulse profile input, blue: linear trend only). Panel d: measured and predicted instantaneous change of the period (Ṗ). The XMM-Newton data are shown with gray circles and are not constraining due to the shorter exposure time of the XMM-Newton observations. The models were fitted without taking Ṗ into account. The good agreement between data and model is therefore an independent confirmation of the orbital ephemeris. The time axis is given in MJD.
Current usage metrics show cumulative count of Article Views (full-text article views including HTML views, PDF and ePub downloads, according to the available data) and Abstracts Views on Vision4Press platform.
Data correspond to usage on the plateform after 2015. The current usage metrics is available 48-96 hours after online publication and is updated daily on week days.
Initial download of the metrics may take a while.