Fig. 4.
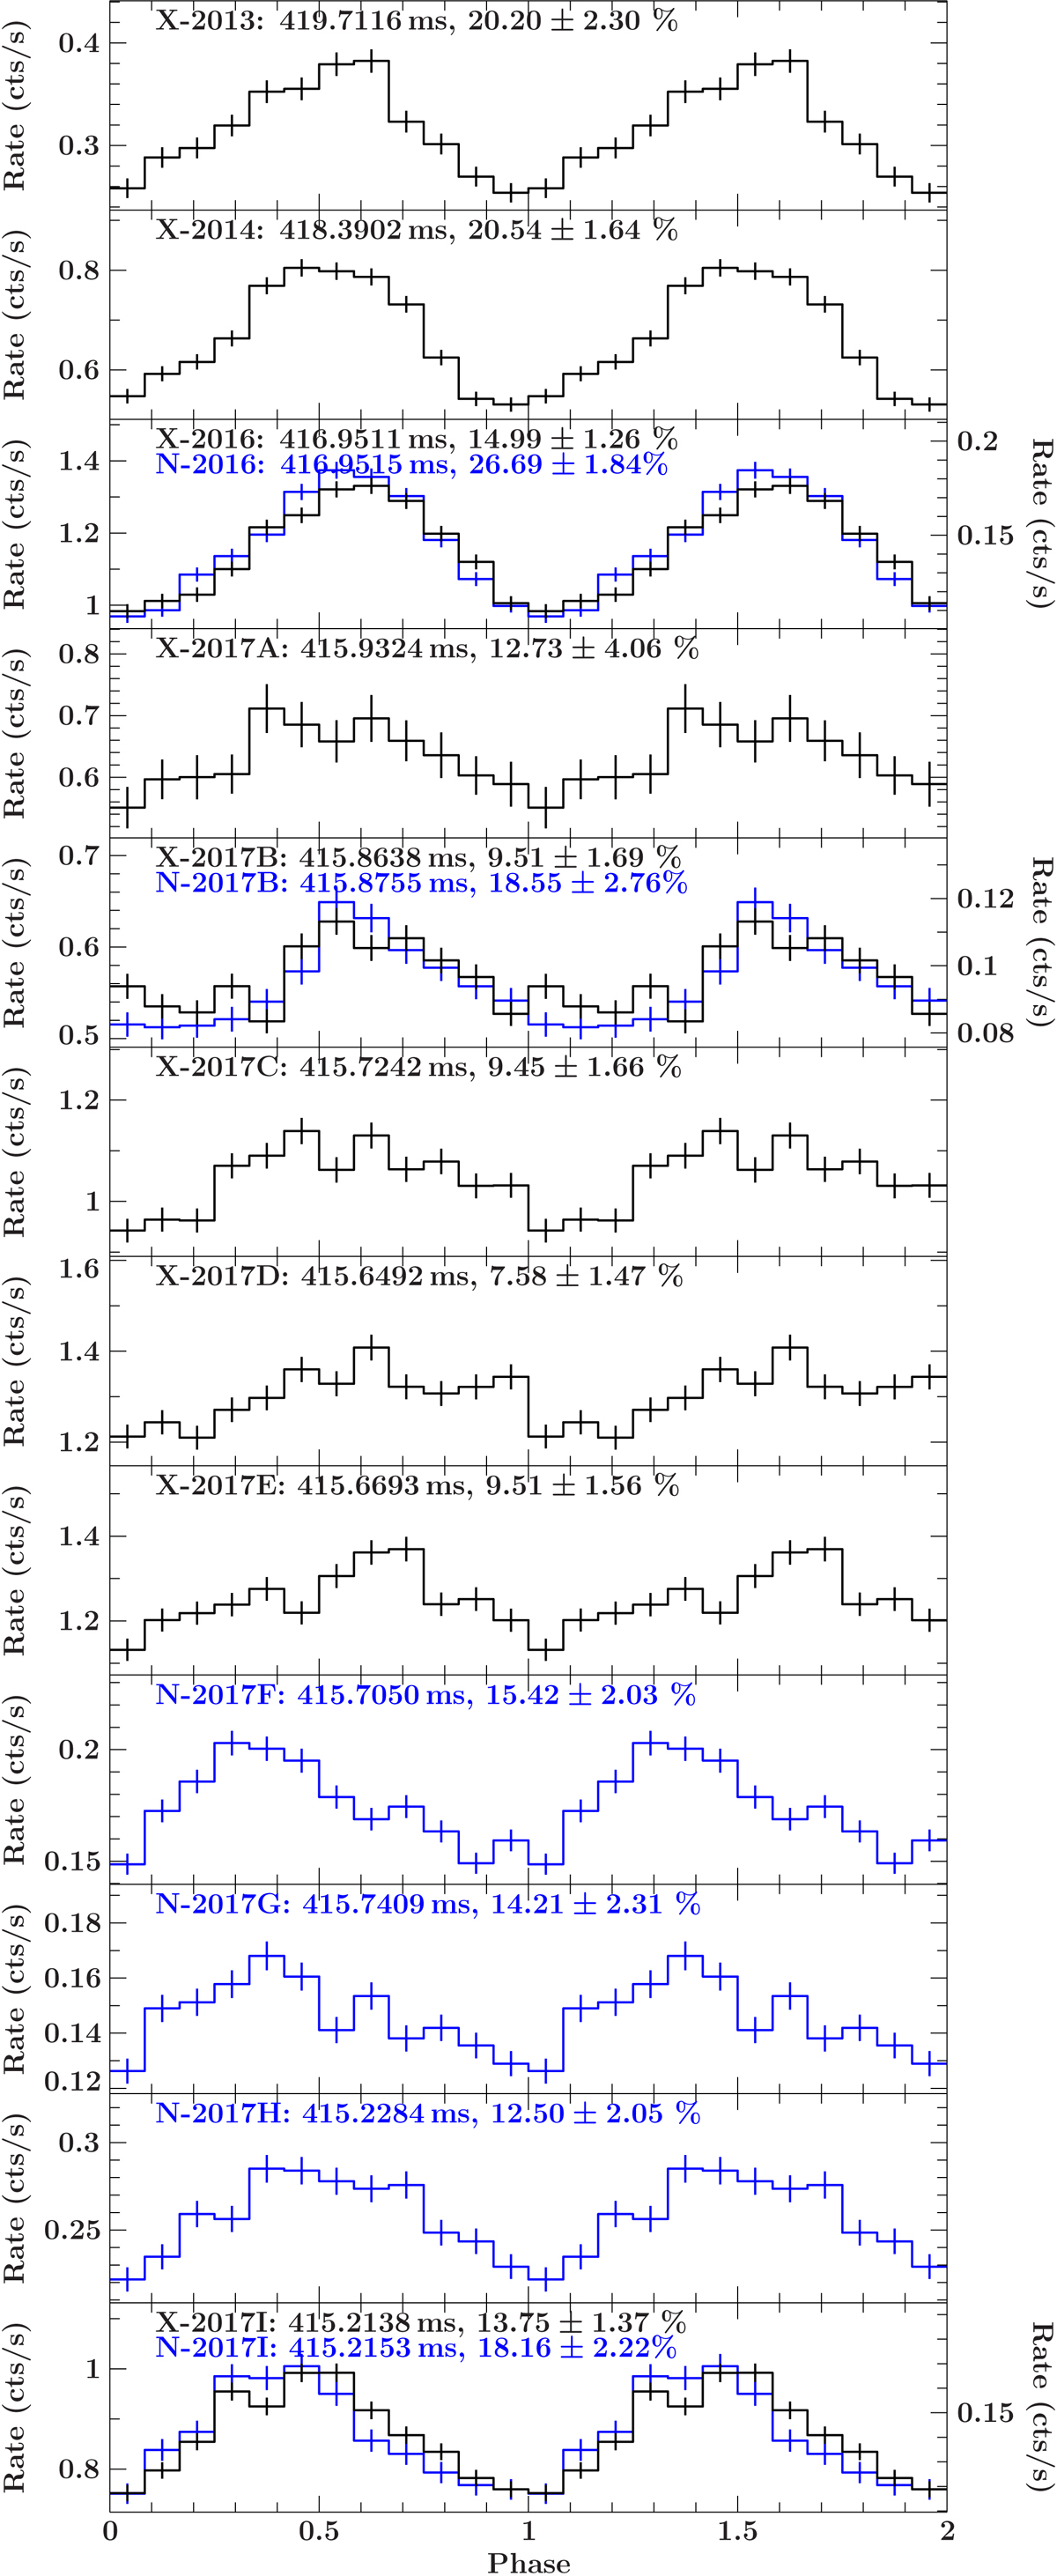
Pulse profiles of all available XMM-Newton and NuSTAR observations, folded on the respective measured pulse period. The profiles are repeated once for clarity and phase-aligned by hand to have the minimum at phase 0. For epochs where XMM-Newton and NuSTAR observations where taken simultaneously, NuSTAR is shown in blue using the right-hand y-scale. Each panel is labeled with the epoch name, pulse period, and measured pulsed fraction in percent. For details see text.
Current usage metrics show cumulative count of Article Views (full-text article views including HTML views, PDF and ePub downloads, according to the available data) and Abstracts Views on Vision4Press platform.
Data correspond to usage on the plateform after 2015. The current usage metrics is available 48-96 hours after online publication and is updated daily on week days.
Initial download of the metrics may take a while.