Fig. 3.
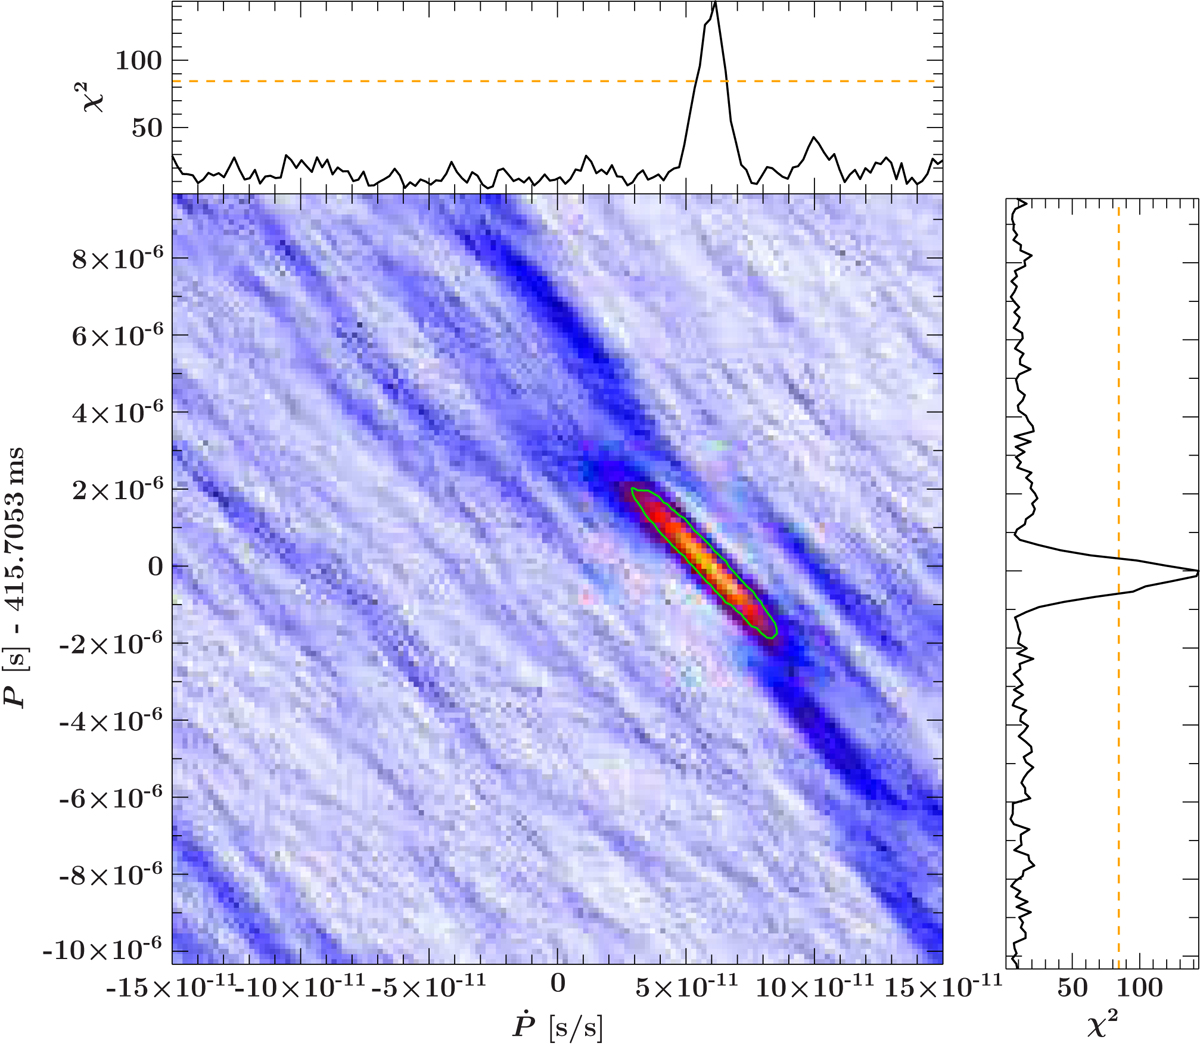
Example of the epoch-folding in P–Ṗ-space for NuSTAR observation 2017F. The χ2 value at each P–Ṗ pair is color-coded. The graphs at the top and on the right show the cut along the respective dimension for the most significant measurement at P = 415.7050 ms and Ṗ = 6.5 × 10⁻¹¹s s−1. The orange dashed line shows the 99.99% significance line taking the number of trial periods into account.
Current usage metrics show cumulative count of Article Views (full-text article views including HTML views, PDF and ePub downloads, according to the available data) and Abstracts Views on Vision4Press platform.
Data correspond to usage on the plateform after 2015. The current usage metrics is available 48-96 hours after online publication and is updated daily on week days.
Initial download of the metrics may take a while.