Fig. 1.
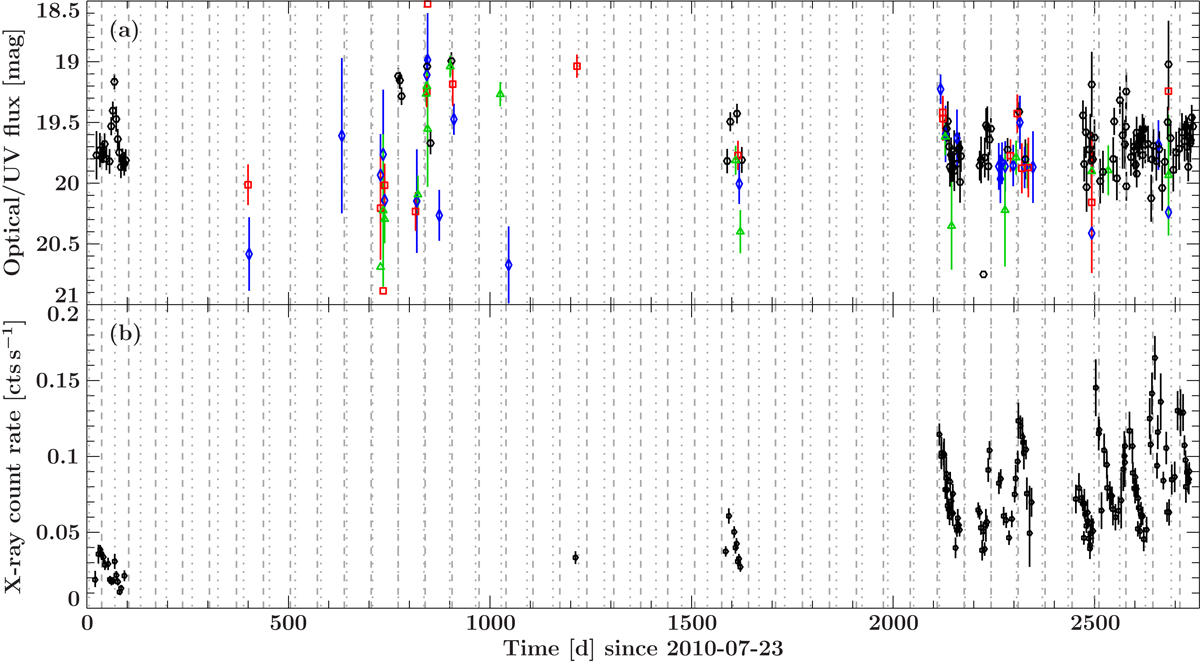
Panel a: light curve from Swift/UVOT, with one data point per observation. Black circles are u-filter, red squares are uvw1-filter, green triangles are uvw2-filter, and blue diamonds are uvm2-filter. Panel b: Swift/XRT light curve in the 0.3–10 keV energy band, with the same binning as the UVOT light curve. Dotted lines mark the times of maximum light in the UVOT data, assuming a constant period of Popt = 63:9 d and dashed lines mark the maximum of the folded XRT profile with a constant period of PX = 66:9 d.
Current usage metrics show cumulative count of Article Views (full-text article views including HTML views, PDF and ePub downloads, according to the available data) and Abstracts Views on Vision4Press platform.
Data correspond to usage on the plateform after 2015. The current usage metrics is available 48-96 hours after online publication and is updated daily on week days.
Initial download of the metrics may take a while.