Free Access
Fig. 5.
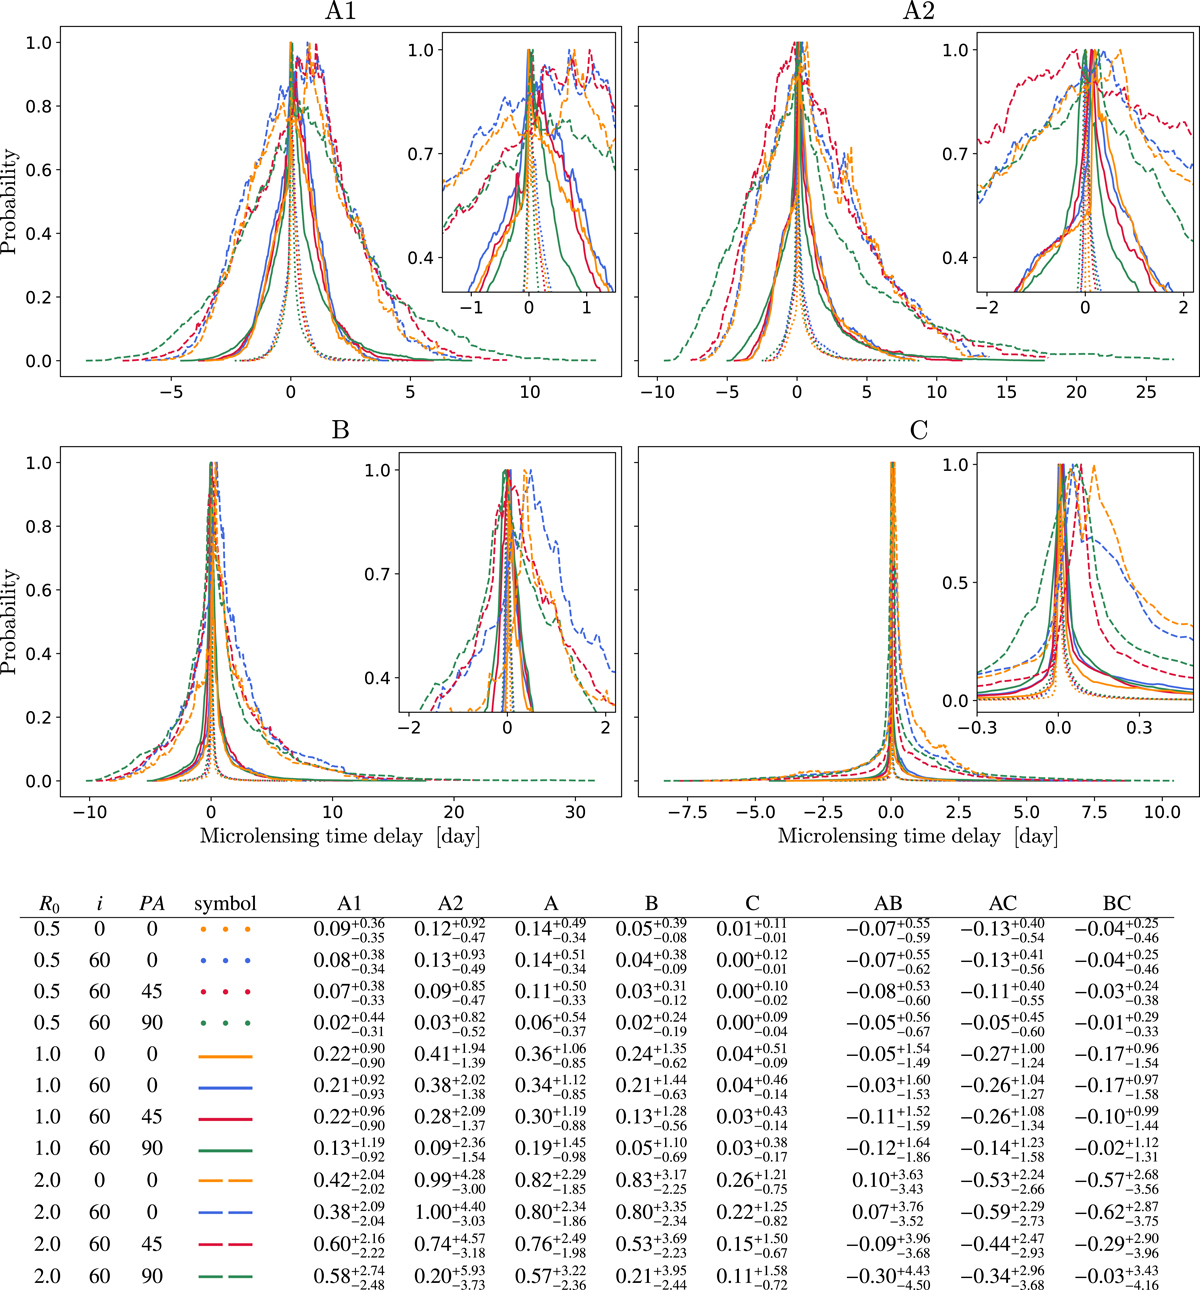
Distributions of the excess of microlensing time delay for the four images of PG 1115+080. The table below the figure reports the 16th, 50th and 84th percentiles of the single image distributions as well as the image pair distributions (see text for details) for the various geometrical configurations explored in this work.
Current usage metrics show cumulative count of Article Views (full-text article views including HTML views, PDF and ePub downloads, according to the available data) and Abstracts Views on Vision4Press platform.
Data correspond to usage on the plateform after 2015. The current usage metrics is available 48-96 hours after online publication and is updated daily on week days.
Initial download of the metrics may take a while.