Fig. 4.
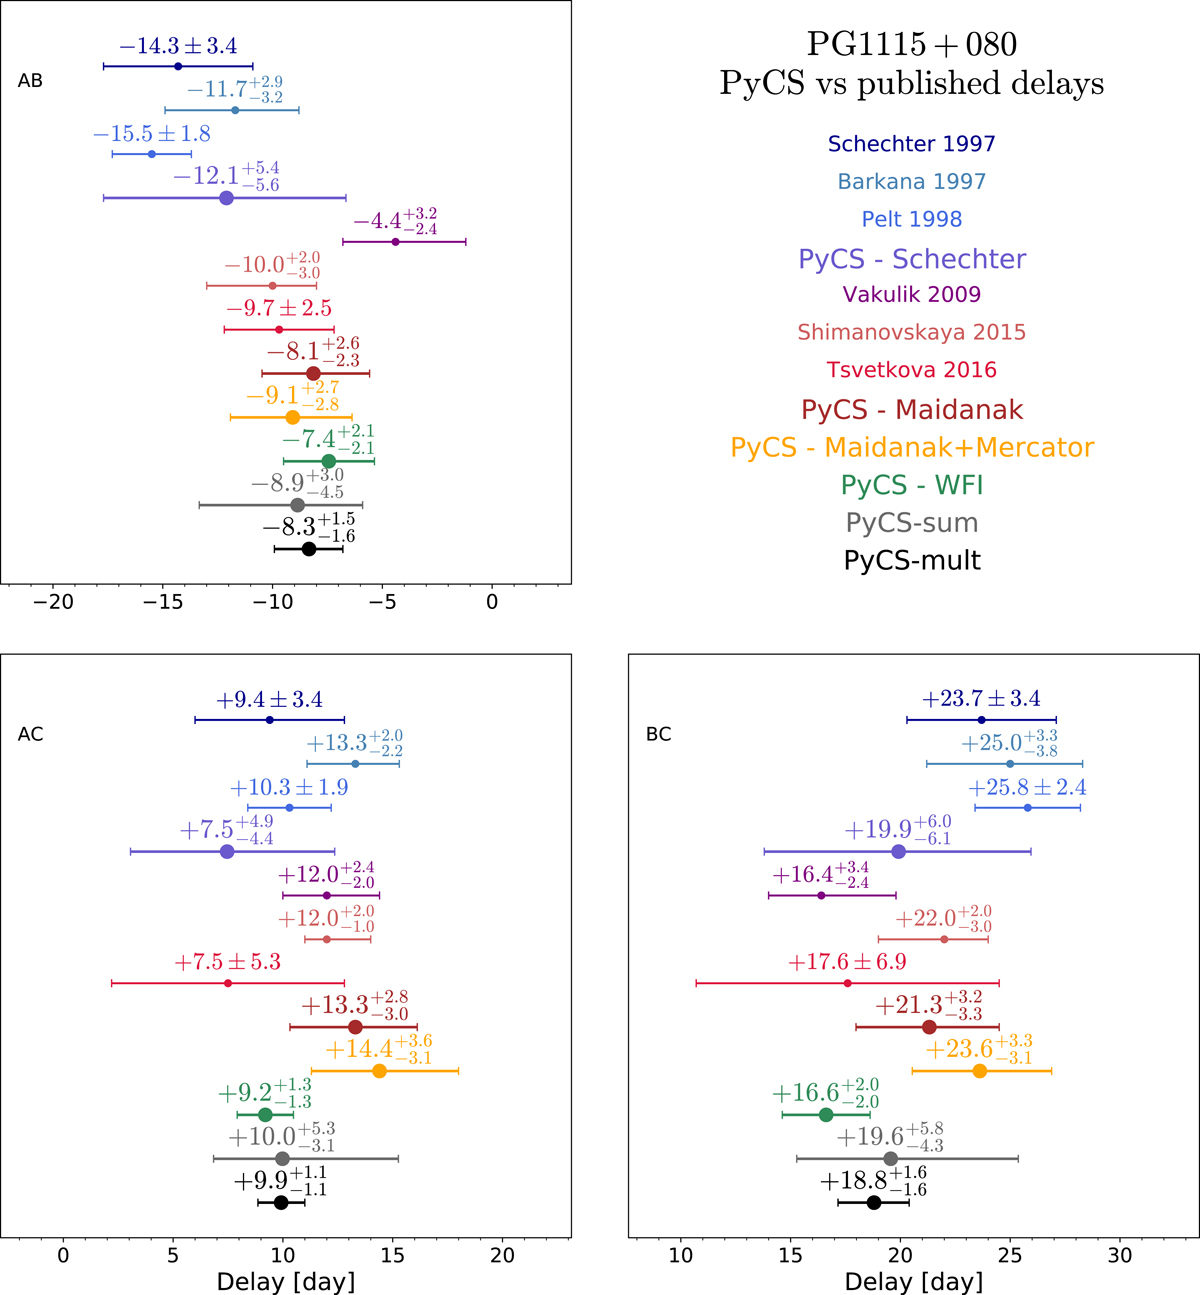
Time delays between the images of PG 1115+080. Each panel compares the already published values from various authors to our own estimates, obtained using PyCS on the same data sets. The new estimates obtained in this work are labeled “PyCS” and are displayed more prominently than the already published estimates. On each panel from top to bottom, the first four estimates are computed using the Schechter data set, the four following estimates are computed using the Maidanak data set. The last two estimates are obtained from two possible combination of our own results on the three data sets, either marginalizing over the probability distributions (PyCS-sum) or multiplying them (PyCS-mult). The quoted mean values and error bars are respectively the 50th, 16th and 84th percentiles of the associated time-delay probability distributions.
Current usage metrics show cumulative count of Article Views (full-text article views including HTML views, PDF and ePub downloads, according to the available data) and Abstracts Views on Vision4Press platform.
Data correspond to usage on the plateform after 2015. The current usage metrics is available 48-96 hours after online publication and is updated daily on week days.
Initial download of the metrics may take a while.