Fig. 3.
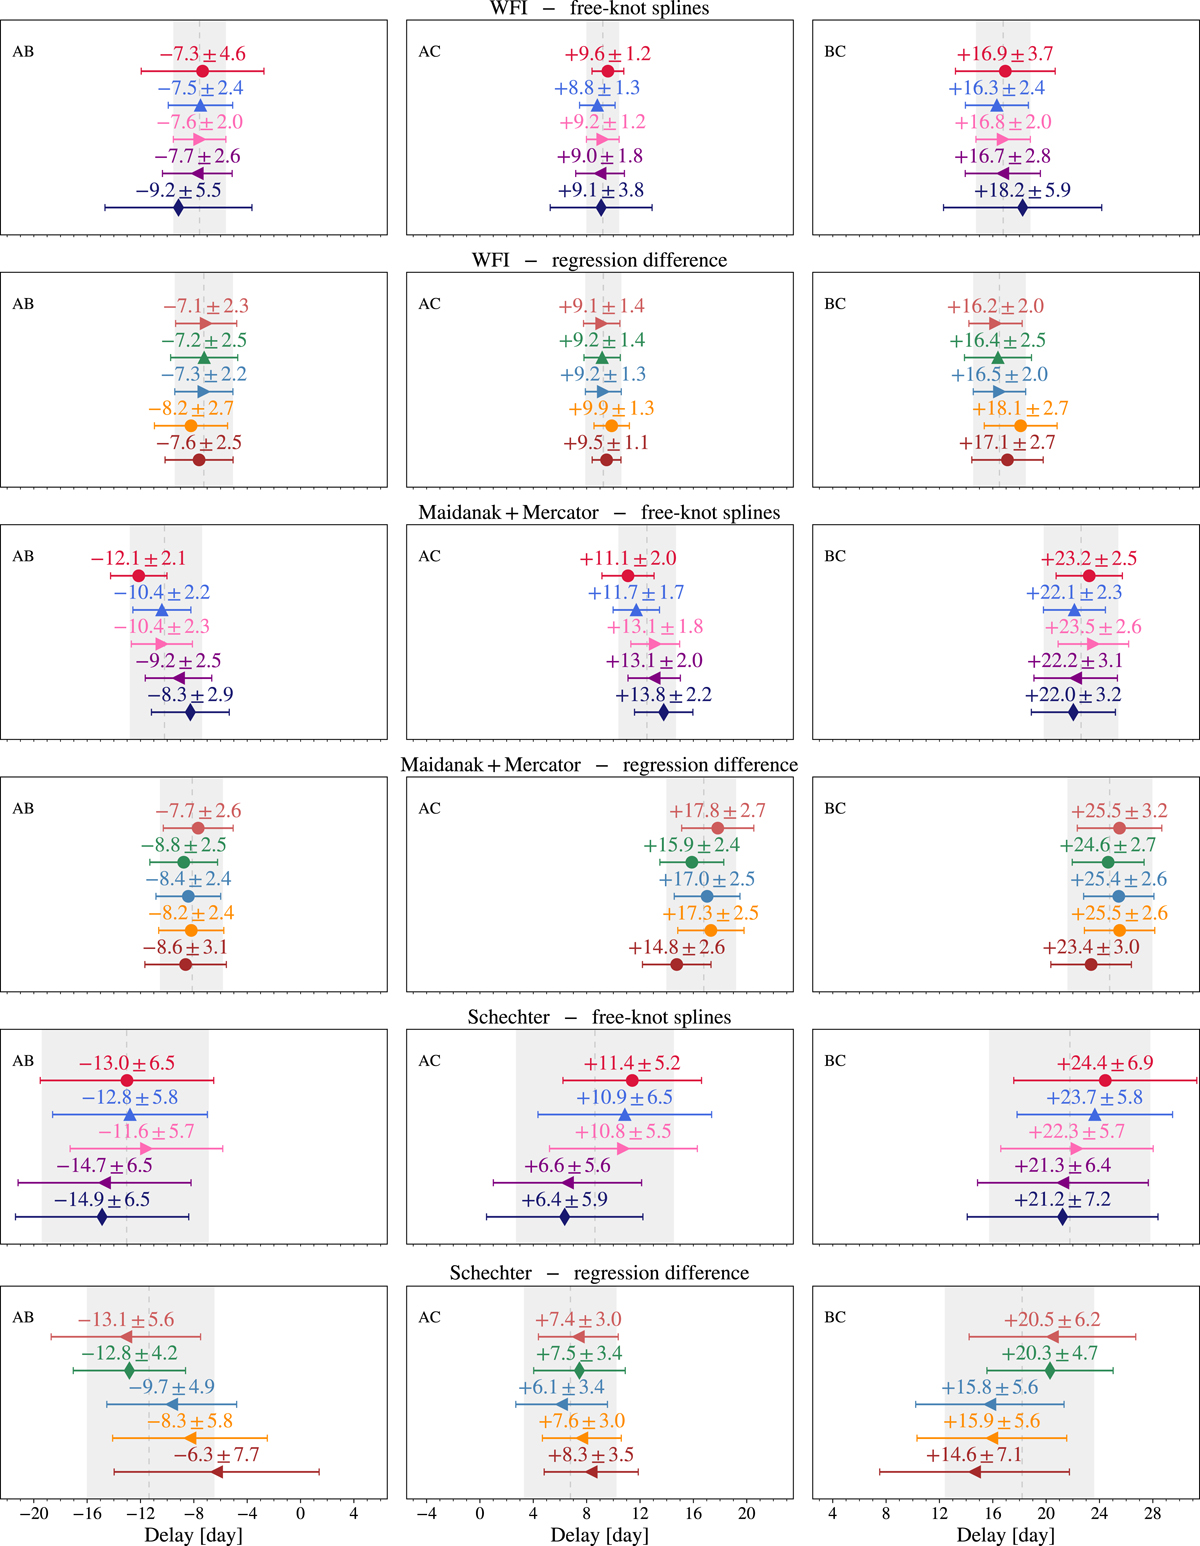
Time delays estimates and uncertainties (including both the statistical and systematic contributions) between the three pairs of light curves of PG 1115+080. Each column corresponds to a given pair of light curves, indicated in the top-left corner of each panel. Each row corresponds to a series, that is groups of time-delay estimates applied on given data set and curve-shifting technique, the name of which is indicated above the central panel. The estimator parameters corresponding to each group of time-delay estimates are indicated in Table 1. For each two consecutive rows, representing time-delay estimates from the same data set, the symbols correspond to the generative model used when drawing the mock light curves. The shaded region in each panel indicates the combined time-delay estimates for τthresh = 0.5 (see text for details).
Current usage metrics show cumulative count of Article Views (full-text article views including HTML views, PDF and ePub downloads, according to the available data) and Abstracts Views on Vision4Press platform.
Data correspond to usage on the plateform after 2015. The current usage metrics is available 48-96 hours after online publication and is updated daily on week days.
Initial download of the metrics may take a while.