Fig. 2.
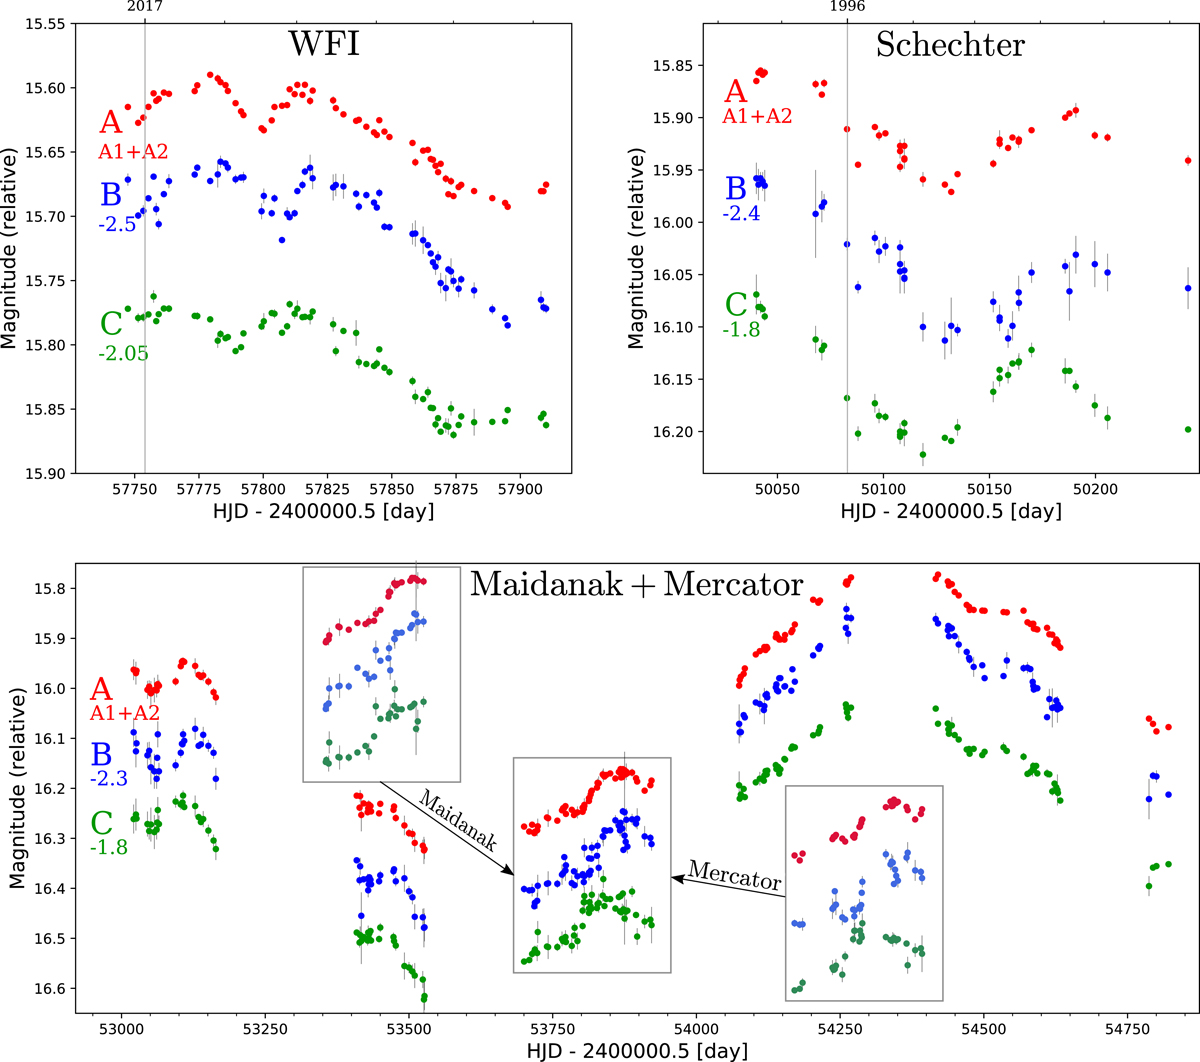
Light curves for the three data sets used in this work. The B and C components of each data set are shifted in magnitude for visual purposes. The A component corresponds to the integrated flux of the unresolved A1 and A2 quasar images. The WFI and Mercator data are new, while the other observations in the Schechter and Maidanak data were published in Schechter et al. (1997) and Tsvetkova et al. (2010), respectively (see Fig. 2 of both papers). Maidanak and Mercator data overlap during the 2006 season only (see text for details). The inserts show the contribution to the 2006 season from both data sets.
Current usage metrics show cumulative count of Article Views (full-text article views including HTML views, PDF and ePub downloads, according to the available data) and Abstracts Views on Vision4Press platform.
Data correspond to usage on the plateform after 2015. The current usage metrics is available 48-96 hours after online publication and is updated daily on week days.
Initial download of the metrics may take a while.