Free Access
Fig. 8
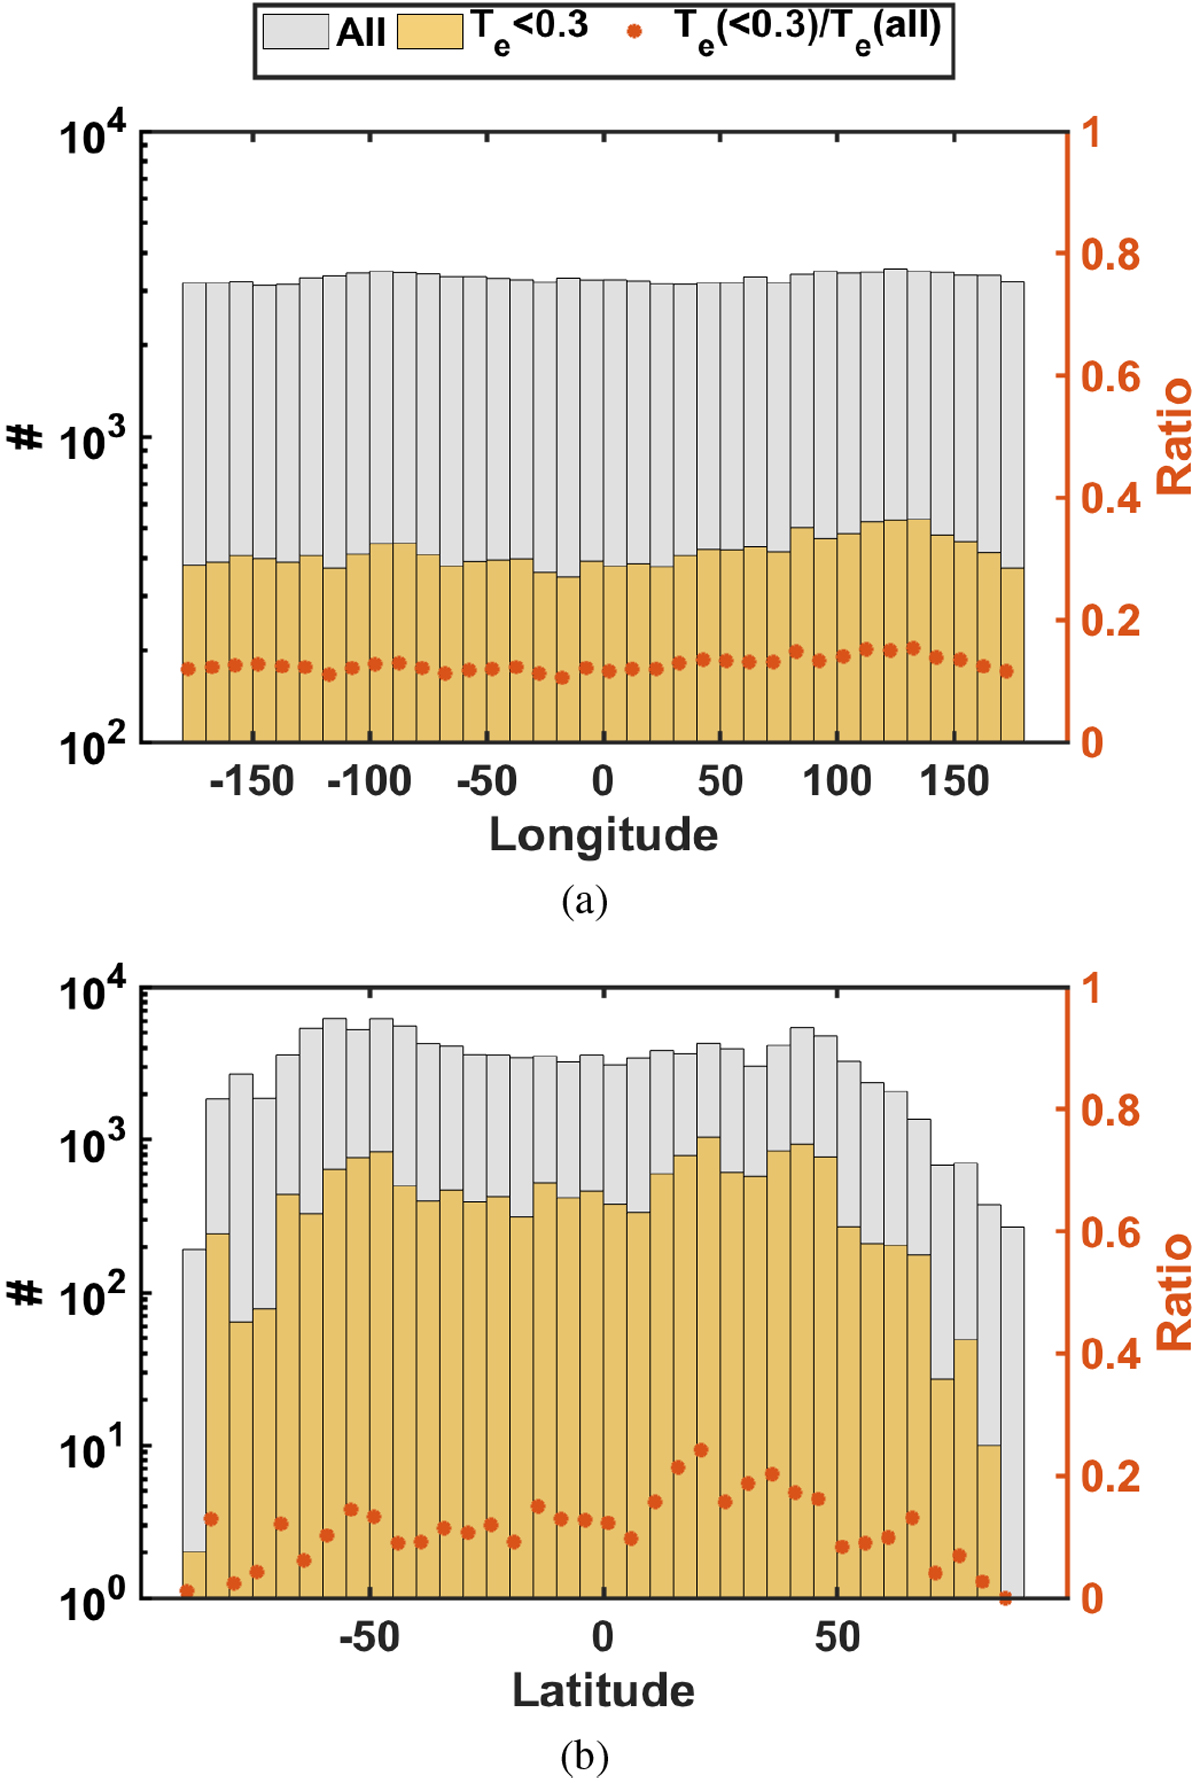
Histograms of all temperatures from all slopes during the whole mission (gray) and of cold electrons of steep slopes (yellow), with the ratio given (red points), and the right y-axis. Panel a shows this vs. longitude, and panel b shows it vs. latitude.
Current usage metrics show cumulative count of Article Views (full-text article views including HTML views, PDF and ePub downloads, according to the available data) and Abstracts Views on Vision4Press platform.
Data correspond to usage on the plateform after 2015. The current usage metrics is available 48-96 hours after online publication and is updated daily on week days.
Initial download of the metrics may take a while.