Free Access
Fig. 7
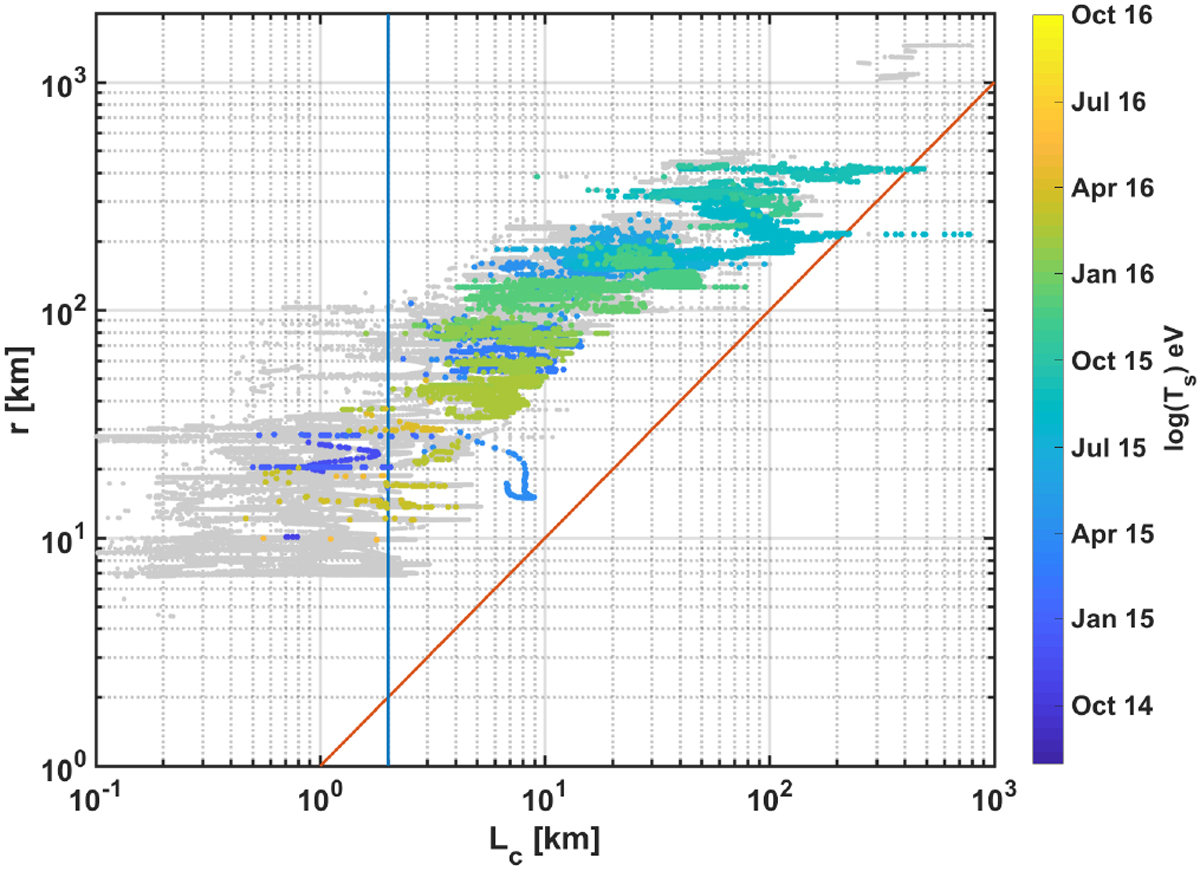
Radial distance vs. electron exobase distance. Colored data show the cold electrons from the steep slope (<0.3 eV and >70 nA V−1). Gray shows all the sweeps. The red line indicates where Lc = r, and the blue line represents the 2 km distance of the nucleus radius.
Current usage metrics show cumulative count of Article Views (full-text article views including HTML views, PDF and ePub downloads, according to the available data) and Abstracts Views on Vision4Press platform.
Data correspond to usage on the plateform after 2015. The current usage metrics is available 48-96 hours after online publication and is updated daily on week days.
Initial download of the metrics may take a while.