Fig. 5
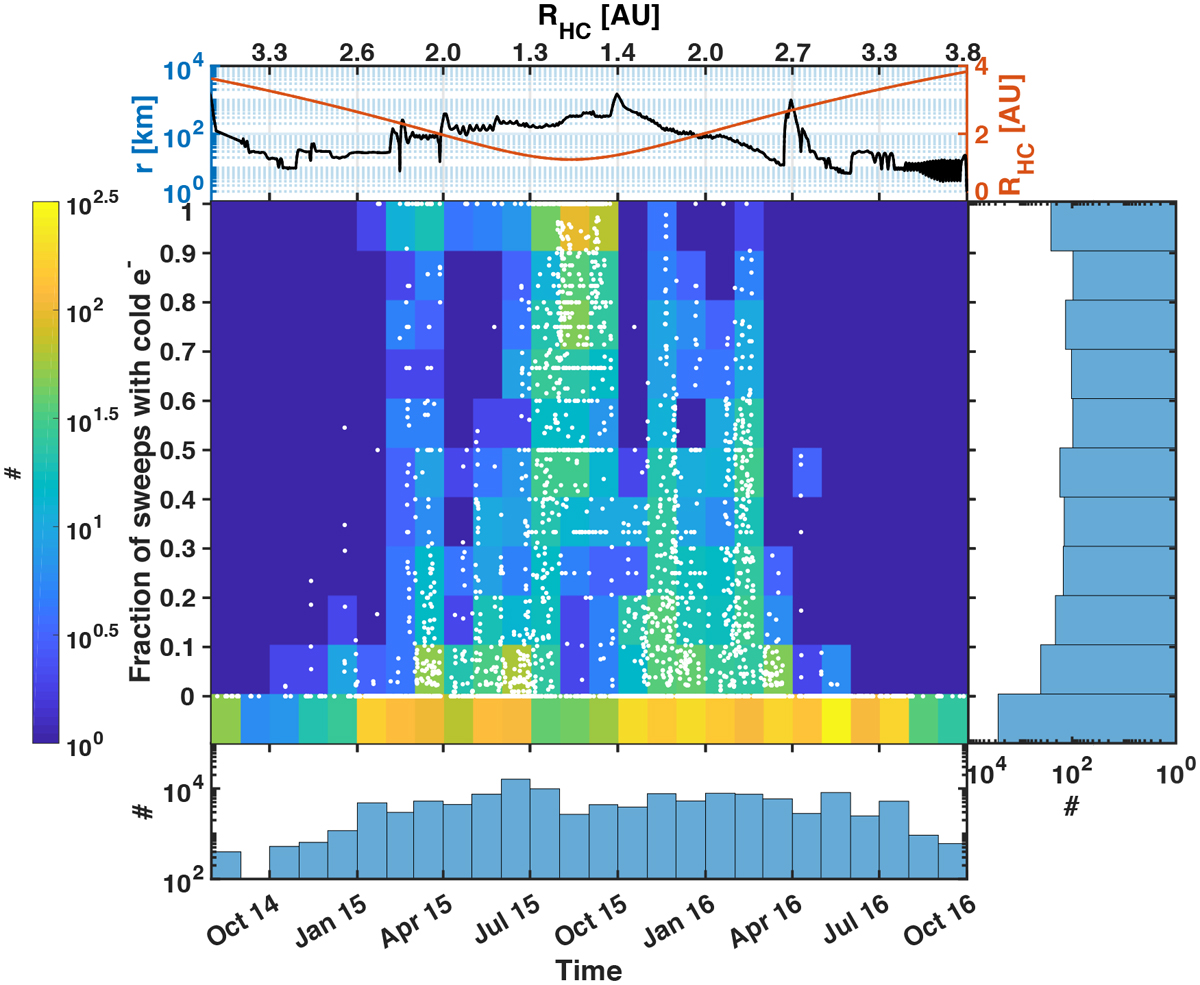
Mission overview of the fraction of sweeps containing cold electrons (Ts < 0.3 eV and S > 70 nA V−1). The top panel shows the radial distance of Rosetta to the nucleus and the heliocentric distance of the comet. The white data points in the main panel show the fraction of sweeps containing cold electrons for every two-hour interval. The coloredbackground shows a 2D histogram representation of the data. The horizontal bins are per month. Tick marks showthe first of the indicated month. The vertical bins are the fraction of sweeps during a two-hour interval that contains cold electrons, each bin spanning 10%. For every month, the color code then gives the total number of two-hour intervals with cold electrons identified in the given fraction of sweeps. The total number of two-hour intervals per month is not constant, as there must be useful LAP and MIP data for at least one data point per two-hour interval. The histograms below and at right show the total bin count.
Current usage metrics show cumulative count of Article Views (full-text article views including HTML views, PDF and ePub downloads, according to the available data) and Abstracts Views on Vision4Press platform.
Data correspond to usage on the plateform after 2015. The current usage metrics is available 48-96 hours after online publication and is updated daily on week days.
Initial download of the metrics may take a while.