Fig. 4
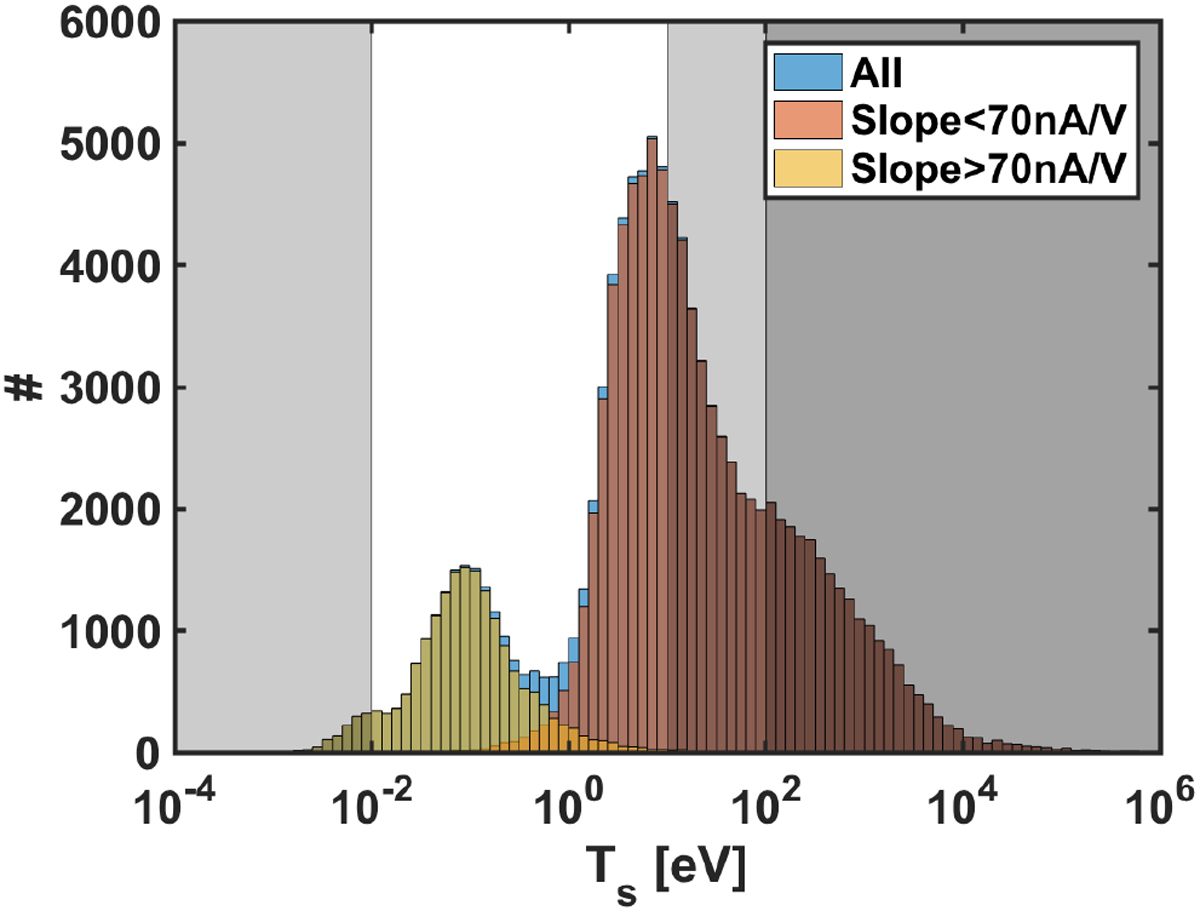
Histogram of electron temperature derived from LAP1 and MIP from the entire Rosetta mission at the comet, August 7, 2014 through September 30, 2016. The yellow and red bars indicate values derived from sweeps with a steep and shallow slope as defined in Fig. 3. Individual data points may have large errors, and the parts of the distributions below 0.01 eV and above 10 eV are not reliable.
Current usage metrics show cumulative count of Article Views (full-text article views including HTML views, PDF and ePub downloads, according to the available data) and Abstracts Views on Vision4Press platform.
Data correspond to usage on the plateform after 2015. The current usage metrics is available 48-96 hours after online publication and is updated daily on week days.
Initial download of the metrics may take a while.