Fig. 2.
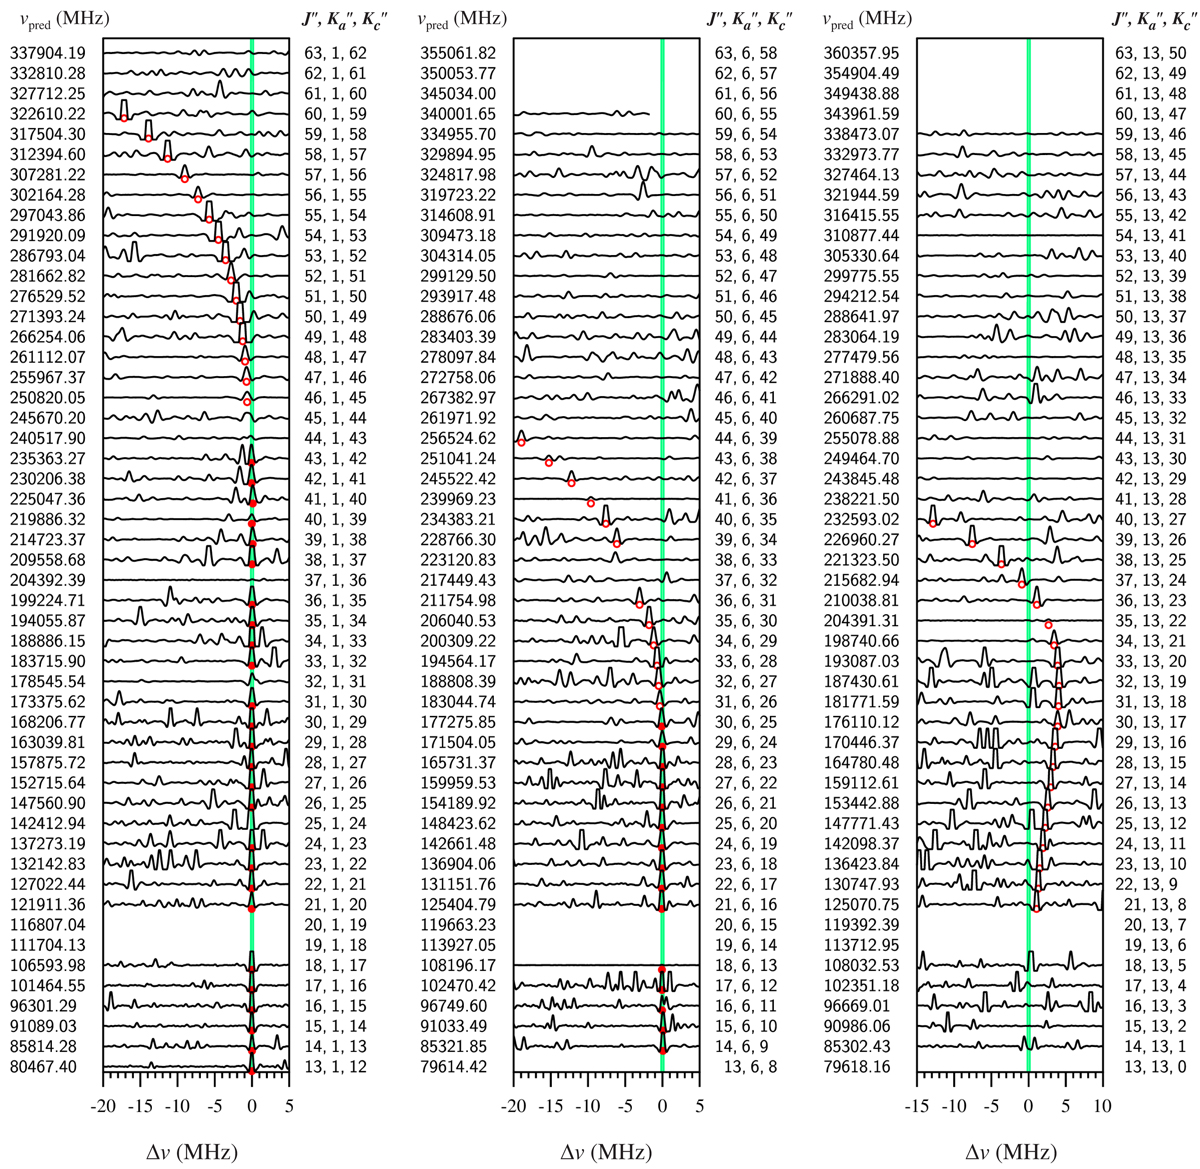
Sample Loomis-Wood-type plots of the rotational spectrum of ethyl isocyanate for Ka = 1, Ka = 6, and Ka = 13 line sequences in the ground vibrational state where sections of the experimental spectrum are plotted around the predicted positions (green vertical line) using the spectroscopic constants from Table 1. Predicted frequency is given on the left side of each plot while the lower state rotational quantum numbers J˝, ![]() , and
, and ![]() c are shown on the right side. Frequency distance from the predicted positions is given by Δv. Red filled circles mark the transition lines that are included in the present semirigid rotor Hamiltonian analysis (Table 4). Red opened circles identify perturbed transitions not included in the fit (Table 5).
c are shown on the right side. Frequency distance from the predicted positions is given by Δv. Red filled circles mark the transition lines that are included in the present semirigid rotor Hamiltonian analysis (Table 4). Red opened circles identify perturbed transitions not included in the fit (Table 5).
Current usage metrics show cumulative count of Article Views (full-text article views including HTML views, PDF and ePub downloads, according to the available data) and Abstracts Views on Vision4Press platform.
Data correspond to usage on the plateform after 2015. The current usage metrics is available 48-96 hours after online publication and is updated daily on week days.
Initial download of the metrics may take a while.